
KMZ last updated Tue, 10 Oct 2023 02:49:07 GMT
Source link
OpenStreetMap
OpenStreetMap is a map of the world, created by people like you and free to use under an open license.
Hosting is supported by UCL, Fastly, Bytemark Hosting, and other partners.
Learn More
Start Mapping
POTENTIAL TROPICAL CYCLONE SIXTEEN-E
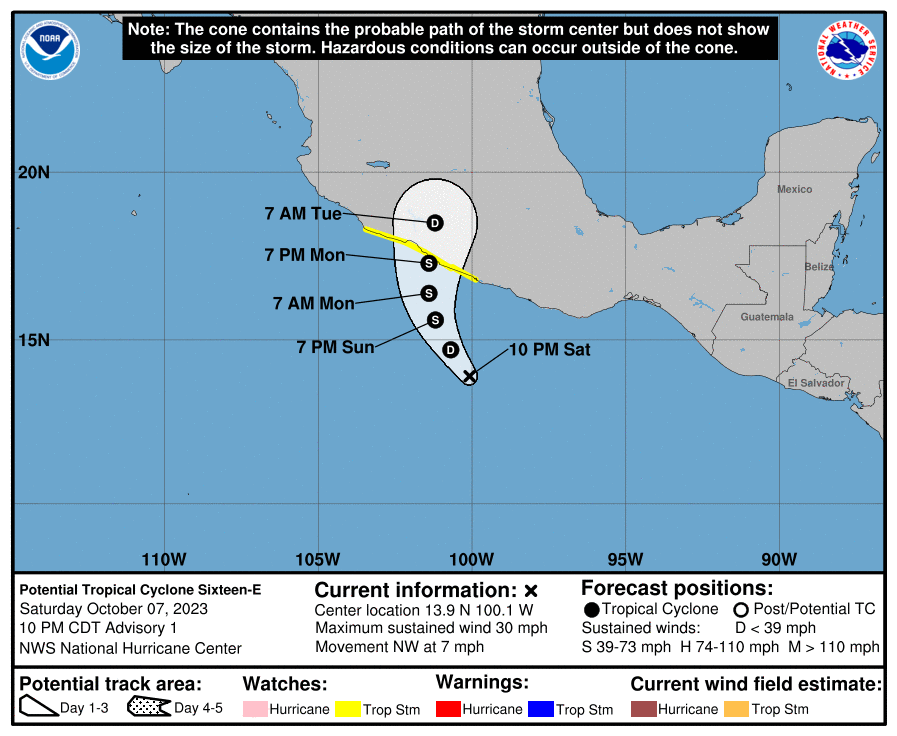
POTENTIAL TROPICAL CYCLONE SIXTEEN-E
Coastal Watches/Warnings and Forecast Cone for Storm Center
* If the storm is forecast to dissipate within 3 days, the “Full Forecast” and “3 day” graphic will be identical
Click Here for a 5-day Cone Printer Friendly Graphic
How to use the cone graphic (video):

About this product:
This graphic shows an approximate representation of coastal areas under a hurricane warning (red), hurricane watch (pink),
tropical storm warning (blue) and tropical storm watch (yellow). The orange circle indicates the current position of the
center of the tropical cyclone. The black line, when selected, and dots show the National Hurricane Center (NHC) forecast track of the center
at the times indicated. The dot indicating the forecast center location will be black if the cyclone is forecast to be
tropical and will be white with a black outline if the cyclone is forecast to be extratropical. If only an L is displayed,
then the system is forecast to be a remnant low. The letter inside the dot indicates the NHC’s forecast intensity for that time:
D: Tropical Depression – wind speed less than 39 MPH
S: Tropical Storm – wind speed between 39 MPH and 73 MPH
H: Hurricane – wind speed between 74 MPH and 110 MPH
M: Major Hurricane – wind speed greater than 110 MPH
NHC tropical cyclone forecast tracks can be in error. This forecast
uncertainty is conveyed by the track forecast “cone”, the solid white
and stippled white areas in the graphic. The solid white area depicts
the track forecast uncertainty for days 1-3 of the forecast, while the
stippled area depicts the uncertainty on days 4-5. Historical data
indicate that the entire 5-day path of the center of the tropical
cyclone will remain within the cone about 60-70% of the time. To
form the cone, a set of imaginary circles are placed along the
forecast track at the 12, 24, 36, 48, 72, 96, and 120 h positions,
where the size of each circle is set so that it encloses 67% of the
previous five years official forecast errors. The cone is then formed
by smoothly connecting the area swept out by the set of circles.
It is also important to realize that a tropical cyclone is not a point. Their
effects can span many hundreds of miles from the center. The area
experiencing hurricane force (one-minute average wind speeds of at least
74 mph) and tropical storm force (one-minute average wind speeds of
39-73 mph) winds can extend well beyond the white areas shown enclosing
the most likely track area of the center. The distribution of hurricane
and tropical storm force winds in this tropical cyclone can be seen in
the Wind History graphic linked above.
Considering the combined forecast uncertainties in track, intensity, and size, the
chances that any particular location will experience winds of 34 kt (tropical storm force),
50 kt, or 64 kt (hurricane force) from this tropical cyclone are presented in
tabular form for selected locations and forecast positions. This information is also presented in
graphical form for the 34 kt, 50 kt,
and 64 kt thresholds.
Note: A detailed definition of the NHC track forecast cone is also available.
Advisory #003 Forecast Track [kmz] – Tropical Storm Lidia (EP5/EP152023)
KMZ last updated Tue, 03 Oct 2023 20:45:46 GMT
Source link
ATCF XML Prototype [xml] – Post-Tropical Cyclone Rina (AT3/AL182023)
Issued at Mon, 02 Oct 2023 02:36:43 GMT. This is only a prototype and the file format may change without notice.
Source link
TROPICAL STORM RINA
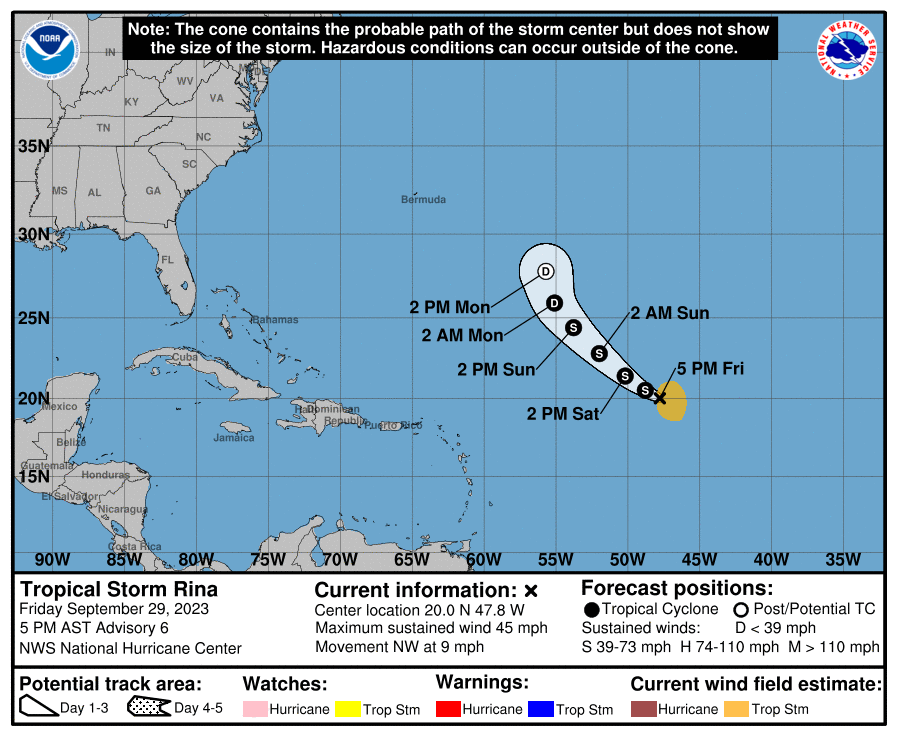
TROPICAL STORM RINA
Coastal Watches/Warnings and Forecast Cone for Storm Center
* If the storm is forecast to dissipate within 3 days, the “Full Forecast” and “3 day” graphic will be identical
Click Here for a 5-day Cone Printer Friendly Graphic
How to use the cone graphic (video):
About this product:
This graphic shows an approximate representation of coastal areas under a hurricane warning (red), hurricane watch (pink),
tropical storm warning (blue) and tropical storm watch (yellow). The orange circle indicates the current position of the
center of the tropical cyclone. The black line, when selected, and dots show the National Hurricane Center (NHC) forecast track of the center
at the times indicated. The dot indicating the forecast center location will be black if the cyclone is forecast to be
tropical and will be white with a black outline if the cyclone is forecast to be extratropical. If only an L is displayed,
then the system is forecast to be a remnant low. The letter inside the dot indicates the NHC’s forecast intensity for that time:
D: Tropical Depression – wind speed less than 39 MPH
S: Tropical Storm – wind speed between 39 MPH and 73 MPH
H: Hurricane – wind speed between 74 MPH and 110 MPH
M: Major Hurricane – wind speed greater than 110 MPH
NHC tropical cyclone forecast tracks can be in error. This forecast
uncertainty is conveyed by the track forecast “cone”, the solid white
and stippled white areas in the graphic. The solid white area depicts
the track forecast uncertainty for days 1-3 of the forecast, while the
stippled area depicts the uncertainty on days 4-5. Historical data
indicate that the entire 5-day path of the center of the tropical
cyclone will remain within the cone about 60-70% of the time. To
form the cone, a set of imaginary circles are placed along the
forecast track at the 12, 24, 36, 48, 72, 96, and 120 h positions,
where the size of each circle is set so that it encloses 67% of the
previous five years official forecast errors. The cone is then formed
by smoothly connecting the area swept out by the set of circles.
It is also important to realize that a tropical cyclone is not a point. Their
effects can span many hundreds of miles from the center. The area
experiencing hurricane force (one-minute average wind speeds of at least
74 mph) and tropical storm force (one-minute average wind speeds of
39-73 mph) winds can extend well beyond the white areas shown enclosing
the most likely track area of the center. The distribution of hurricane
and tropical storm force winds in this tropical cyclone can be seen in
the Wind History graphic linked above.
Considering the combined forecast uncertainties in track, intensity, and size, the
chances that any particular location will experience winds of 34 kt (tropical storm force),
50 kt, or 64 kt (hurricane force) from this tropical cyclone are presented in
tabular form for selected locations and forecast positions. This information is also presented in
graphical form for the 34 kt, 50 kt,
and 64 kt thresholds.
Note: A detailed definition of the NHC track forecast cone is also available.
Advisory #010 Forecast Track [kmz] – Tropical Storm Philippe (AT2/AL172023)
KMZ last updated Mon, 25 Sep 2023 20:37:44 GMT
Source link
Tropical Depression Ophelia Public Advisory
000
WTNT31 KNHC 240006
TCPAT1

BULLETIN
Tropical Depression Ophelia
Intermediate Advisory Number 10A...Retransmitted
NWS National Hurricane Center Miami FL       AL162023
800 PM EDT Sat Sep 23 2023

...OPHELIA NOW A TROPICAL DEPRESSION...
...ALL STORM SURGE AND TROPICAL STORM WARNINGS DISCONTINUED...


SUMMARY OF 800 PM EDT...0000 UTC...INFORMATION
----------------------------------------------
LOCATION...37.0N 77.6W
ABOUT 40 MI...60 KM SSW OF RICHMOND VIRGINIA
ABOUT 165 MI...265 KM WSW OF OCEAN CITY MARYLAND
MAXIMUM SUSTAINED WINDS...35 MPH...55 KM/H
PRESENT MOVEMENT...N OR 355 DEGREES AT 9 MPH...15 KM/H
MINIMUM CENTRAL PRESSURE...1000 MB...29.53 INCHES


WATCHES AND WARNINGS
--------------------
CHANGES WITH THIS ADVISORY:

All Storm Surge and Tropical Storm Warnings have been discontinued.


SUMMARY OF WATCHES AND WARNINGS IN EFFECT:

Coastal flooding warnings and wind advisories remain in effect for
portions of the U.S. Mid-Atlantic.  For storm information specific
to your area, please monitor products issued by your local National
Weather Service forecast office.


DISCUSSION AND OUTLOOK
----------------------
At 800 PM EDT (0000 UTC), the center of Tropical Depression Ophelia
was located near latitude 37.0 North, longitude 77.6 West. Ophelia
is moving toward the north near 9 mph (15 km/h). A gradual turn
toward the northeast is expected by tomorrow. On the forecast track,
the center of Ophelia is expected to continue moving over
southeastern Virginia through tonight, and then over the Delmarva
Peninsula by tomorrow.

Maximum sustained winds have decreased to near 35 mph (55 km/h)
with higher gusts.  Additional weakening is expected, and Ophelia
is likely to become a post-tropical cyclone tomorrow.

The estimated minimum central pressure is 1000 mb (29.53 inches).


HAZARDS AFFECTING LAND
----------------------
Key messages for Ophelia can be found in the Tropical Cyclone
Discussion under AWIPS header MIATCDAT1, WMO header WTNT41 KNHC,
and on the web at hurricanes.gov/text/MIATCDAT1.shtml

STORM SURGE:  The combination of storm surge and the tide will cause
normally dry areas near the coast to be flooded by rising waters
moving inland from the shoreline.  The water could reach the
following heights above ground somewhere in the indicated areas if
the peak surge occurs at the time of high tide...

Hatteras Inlet, NC to Manasquan Inlet, NJ...1-3 ft
Chesapeake Bay and Tidal Rivers...1-3 ft
Delaware Bay...1-3 ft
Beaufort Inlet, NC to Hatteras Inlet, NC...1-2 ft
Neuse, Bay, Pamlico, and Pungo Rivers...1-2 ft
Albemarle and Pamlico Sound...1-2 ft

The deepest water will occur along the immediate coast in areas of
onshore winds, where the surge will be accompanied by dangerous
waves.  Surge-related flooding depends on the relative timing of the
surge and the tidal cycle, and can vary greatly over short
distances.  For information specific to your area, please see
products issued by your local National Weather Service forecast
office.

WIND:  Gusty winds to tropical storm force are still possible near
the coasts of North Carolina and Virginia during the next few hours.

RAINFALL:  Ophelia is expected to produce the following additional
rainfall through Sunday night:

Portions of the Mid-Atlantic from north central North Carolina
through New Jersey...1 to 3 inches with isolated higher totals up
to 5 inches.

Across southeastern New York through southern New England...1 to 3
inches.

This rainfall may produce locally considerable flash, urban, and
small stream flooding impacts, particularly across the Mid Atlantic
region from North Carolina to New Jersey. Isolated river flooding is
possible in areas of heavier rainfall.

SURF:  Swells generated by Ophelia will continue to affect much of
the east coast of the United States through the weekend.  These
swells are likely to cause life-threatening surf and rip current
conditions. Please consult products from your local weather office.

TORNADOES:  A tornado or two may occur through tonight across parts
of the Mid-Atlantic Coast.


NEXT ADVISORY
-------------
Next complete advisory at 1100 PM EDT.

$$
Forecaster Berg
OpenStreetMap
OpenStreetMap is a map of the world, created by people like you and free to use under an open license.
Hosting is supported by UCL, Fastly, Bytemark Hosting, and other partners.
Learn More
Start Mapping
Advisory #002 Forecast Track [kmz] – Tropical Storm Kenneth (EP3/EP132023)
KMZ last updated Tue, 19 Sep 2023 20:37:41 GMT
Source link