
KMZ last updated Mon, 15 Aug 2022 14:41:57 GMT
Source link
Advisory #013 Forecast Track [kmz] – Hurricane Howard (EP4/EP092022)
KMZ last updated Tue, 09 Aug 2022 14:39:05 GMT
Source link
Tropical Depression Nine-E Forecast Discussion
480
WTPZ44 KNHC 071441
TCDEP4

Tropical Depression Nine-E Discussion Number   5
NWS National Hurricane Center Miami FL       EP092022
900 AM MDT Sun Aug 07 2022

The depression remains disheveled this morning, with the center of
the system still partially exposed to the southwest of the deepest
convective activity. This structure is primarily due to dry air
being imported to the center by moderate southwesterly vertical wind
shear (VWS). Subjective Dvorak intensity estimates were T2.5/35 kt
from TAFB, T2.0/30 kt from SAB, while the latest objective estimate
from UW-CIMSS ADT was T2.5/35 kt. Given the lackluster satellite
presentation, the initial intensity was held at 30 kt for this
advisory.

The depression is now moving northwest as a slightly slower pace,
estimated at 315/10 kt. A mid-level ridge located northeast of the
system is expected to steer it generally northwestward over the next
few days. One interesting note in the immediate future is there is a
weakness in this ridge to the north, partially related to an
upper-level trough currently shearing the depression. If the system
is able to become better aligned vertically, this could lead to a
rightward shift in the short-term track. The NHC track forecast
accounts for this possibility by being located on the right side of
the track guidance envelope over the next 12-36 hours. This track is
just a bit northeast of the previous one, though it blends back
towards the consensus aids by the end of the forecast, when the
system will likely be steered by the low-level trade wind flow.

A weak upper-level trough located northwest of the depression is the
primary feature maintaining southwesterly VWS over the system. Over
the next day or so, both the GFS and ECMWF suggest this feature
should decay and shift southwest, perhaps related to convection
building up-shear around the depression while helping to align its
low and mid-level centers. Should this process occur,
intensification still appears possible. One alternate solution is
that convective outflow is not able to displace the upper-level low
and some amount of shear is maintained over the system. For now, the
latest NHC intensity forecast will maintain a peak of 45 kt in 36-48
hours, right around the time the system will be crossing the 26 C
sea surface temperature (SST) isotherm. After that time, weakening
is expected over even cooler SSTs and a more stable environment. The
system is still expected to become a post-tropical remnant low at
the end of the forecast period. This intensity forecast is on the
high side of the guidance envelope overall, but is close to the
latest HCCA consensus aid.


FORECAST POSITIONS AND MAX WINDS

INIT  07/1500Z 16.8N 109.9W   30 KT  35 MPH
 12H  08/0000Z 17.9N 111.1W   35 KT  40 MPH
 24H  08/1200Z 19.4N 112.6W   40 KT  45 MPH
 36H  09/0000Z 20.7N 114.2W   45 KT  50 MPH
 48H  09/1200Z 21.7N 115.9W   45 KT  50 MPH
 60H  10/0000Z 22.5N 117.7W   40 KT  45 MPH
 72H  10/1200Z 23.1N 119.3W   35 KT  40 MPH
 96H  11/1200Z 24.0N 122.5W   30 KT  35 MPH
120H  12/1200Z 24.0N 125.5W   25 KT  30 MPH...POST-TROP/REMNT LOW

$$
Forecaster Papin
Advisory #029 Forecast Track [kmz] – Tropical Depression Georgette (EP3/EP082022)
KMZ last updated Wed, 03 Aug 2022 14:41:10 GMT
Source link
TROPICAL STORM FRANK
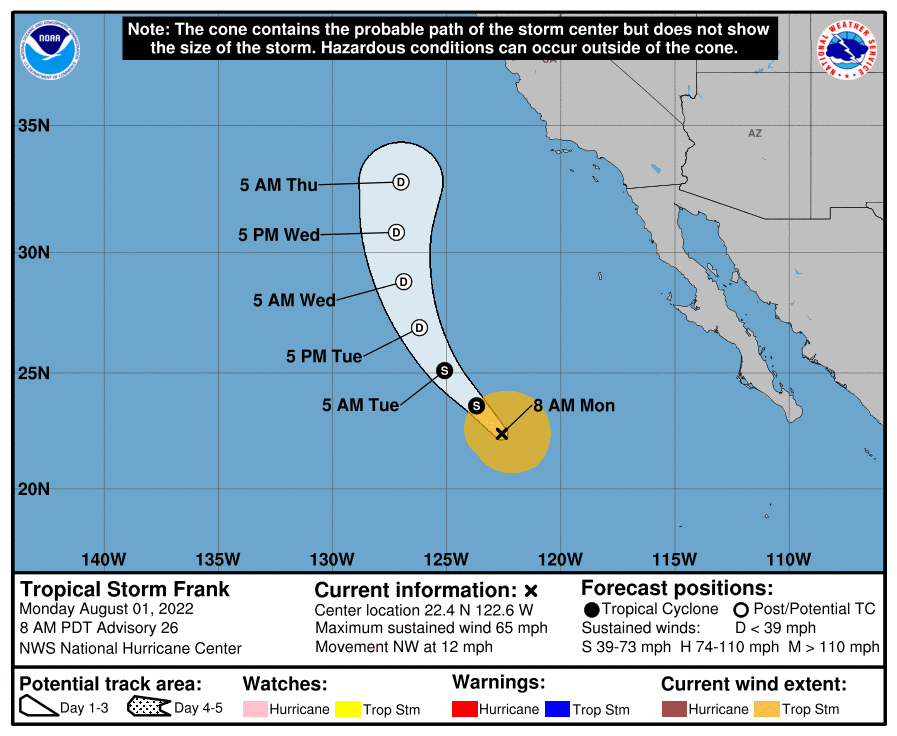
TROPICAL STORM FRANK
Coastal Watches/Warnings and Forecast Cone for Storm Center

* If the storm is forecast to dissipate within 3 days, the “Full Forecast” and “3 day” graphic will be identical
Click Here for a 5-day Cone Printer Friendly Graphic
How to use the cone graphic (video):

About this product:
This graphic shows an approximate representation of coastal areas under a hurricane warning (red), hurricane watch (pink),
tropical storm warning (blue) and tropical storm watch (yellow). The orange circle indicates the current position of the
center of the tropical cyclone. The black line, when selected, and dots show the National Hurricane Center (NHC) forecast track of the center
at the times indicated. The dot indicating the forecast center location will be black if the cyclone is forecast to be
tropical and will be white with a black outline if the cyclone is forecast to be extratropical. If only an L is displayed,
then the system is forecast to be a remnant low. The letter inside the dot indicates the NHC’s forecast intensity for that time:
D: Tropical Depression – wind speed less than 39 MPH
S: Tropical Storm – wind speed between 39 MPH and 73 MPH
H: Hurricane – wind speed between 74 MPH and 110 MPH
M: Major Hurricane – wind speed greater than 110 MPH
NHC tropical cyclone forecast tracks can be in error. This forecast
uncertainty is conveyed by the track forecast “cone”, the solid white
and stippled white areas in the graphic. The solid white area depicts
the track forecast uncertainty for days 1-3 of the forecast, while the
stippled area depicts the uncertainty on days 4-5. Historical data
indicate that the entire 5-day path of the center of the tropical
cyclone will remain within the cone about 60-70% of the time. To
form the cone, a set of imaginary circles are placed along the
forecast track at the 12, 24, 36, 48, 72, 96, and 120 h positions,
where the size of each circle is set so that it encloses 67% of the
previous five years official forecast errors. The cone is then formed
by smoothly connecting the area swept out by the set of circles.
It is also important to realize that a tropical cyclone is not a point. Their
effects can span many hundreds of miles from the center. The area
experiencing hurricane force (one-minute average wind speeds of at least
74 mph) and tropical storm force (one-minute average wind speeds of
39-73 mph) winds can extend well beyond the white areas shown enclosing
the most likely track area of the center. The distribution of hurricane
and tropical storm force winds in this tropical cyclone can be seen in
the Wind History graphic linked above.
Considering the combined forecast uncertainties in track, intensity, and size, the
chances that any particular location will experience winds of 34 kt (tropical storm force),
50 kt, or 64 kt (hurricane force) from this tropical cyclone are presented in
tabular form for selected locations and forecast positions. This information is also presented in
graphical form for the 34 kt, 50 kt,
and 64 kt thresholds.
Note: A detailed definition of the NHC track forecast cone is also available.
OpenStreetMap
OpenStreetMap is a map of the world, created by people like you and free to use under an open license.
Hosting is supported by UCL, Fastly, Bytemark Hosting, and other partners.
Learn More
Start Mapping
Advisory #009 Forecast Track [kmz] – Tropical Storm Frank (EP2/EP072022)
KMZ last updated Thu, 28 Jul 2022 08:49:42 GMT
Source link
Tropical Depression Seven-E Forecast Discussion
000
WTPZ42 KNHC 260856 CCA
TCDEP2

Tropical Depression Seven-E Discussion Number   1...Corrected
NWS National Hurricane Center Miami FL       EP072022
400 AM CDT Tue Jul 26 2022

Conventional satellite imagery shows that deep convection associated
with the low pressure area south of southern Mexico has continued
to increase and become better organized.  An earlier SSMIS
microwave overpass revealed an improved low-level structure,
although most of the deep convection was located over the western
portion of the system due to moderate easterly shear.  A couple of
scatterometer overpasses between 0330 and 0500 UTC showed that the
circulation had become much better defined and the system had peak
winds around 30 kt.  Subjective Dvorak T-numbers from SAB and TAFB
have also increased to T2.0, and based on all the above data,
advisories are being initiated on Tropical Depression Seven-E.  The
initial wind speed is set at 30 kt, in agreement with both the
ASCAT data and the subjective Dvorak estimates.

Moderate easterly shear is forecast to plague the system over the
next 24 to 48 hours, however most of the intensity guidance
suggests gradual strengthening will occur during that time.  The
official forecast follows suit and calls for the depression to
become a tropical storm later today or tonight. After 48 hours, the
shear is expected to abate while the system is over SSTs of 28-29C
and within a moist low- to mid-level environment.  Those conditions
favor a faster rate of strengthening, and this is reflected in the
NHC forecast which shows the system becoming a hurricane in about 72
hours.  The intensity forecast is in good agreement with the HCCA
and IVCN consensus aids and is also supported by the global model
guidance which depicts more significant deepening in 2-3 days.

The initial motion estimate is a somewhat uncertain 280/10 kt. The
cyclone is expected to continue westward for the next few days while
it is steered by a subtropical ridge that extends westward from
northern Mexico.  After that time, the GFS and ECMWF models develop
a slight weakness in the ridge off the coast of Baja California
which allows the system to turn west-northwestward. The UKMET
depicts a stronger ridge and a more westward track than the
remainder of the guidance and its ensemble mean.  As a result, the
official forecast is closer to a blend of the GFS and ECMWF models,
and a bit north and east of the TVCE multi-model consensus.


FORECAST POSITIONS AND MAX WINDS

INIT  26/0900Z 11.4N 101.8W   30 KT  35 MPH
 12H  26/1800Z 11.8N 103.6W   35 KT  40 MPH
 24H  27/0600Z 12.1N 105.6W   40 KT  45 MPH
 36H  27/1800Z 12.2N 107.4W   45 KT  50 MPH
 48H  28/0600Z 12.5N 109.1W   50 KT  60 MPH
 60H  28/1800Z 12.8N 110.8W   60 KT  70 MPH
 72H  29/0600Z 13.3N 112.6W   70 KT  80 MPH
 96H  30/0600Z 14.9N 116.2W   80 KT  90 MPH
120H  31/0600Z 17.5N 119.7W   80 KT  90 MPH

$$
Forecaster Brown
OpenStreetMap
OpenStreetMap is a map of the world, created by people like you and free to use under an open license.
Hosting is supported by UCL, Fastly, Bytemark Hosting, and other partners.
Learn More
Start Mapping
TROPICAL STORM ESTELLE
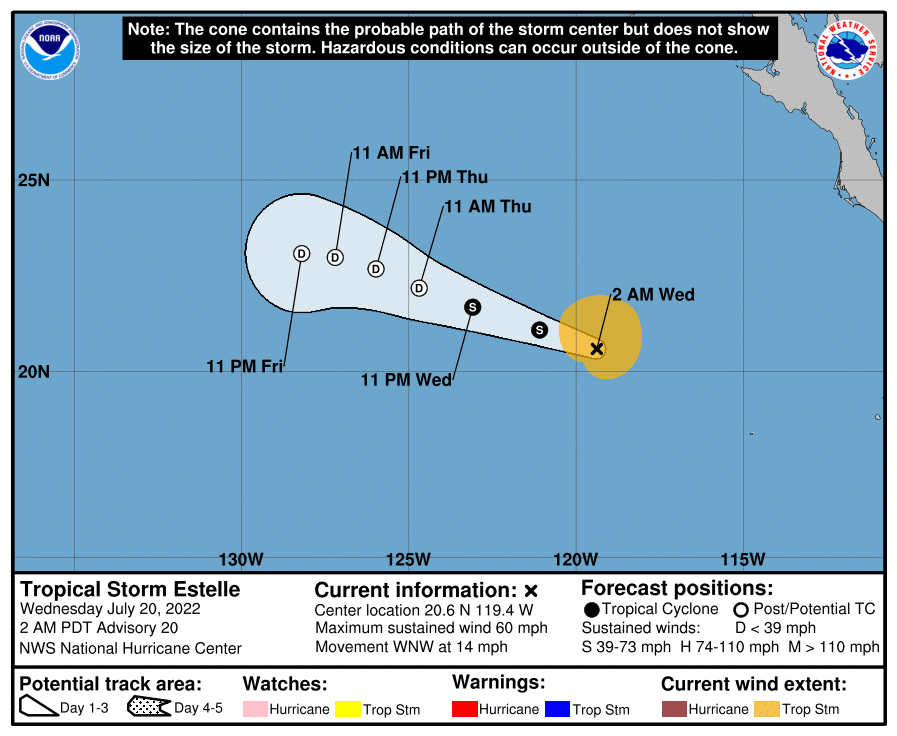
TROPICAL STORM ESTELLE
Coastal Watches/Warnings and Forecast Cone for Storm Center

* If the storm is forecast to dissipate within 3 days, the “Full Forecast” and “3 day” graphic will be identical
Click Here for a 5-day Cone Printer Friendly Graphic
How to use the cone graphic (video):
About this product:
This graphic shows an approximate representation of coastal areas under a hurricane warning (red), hurricane watch (pink),
tropical storm warning (blue) and tropical storm watch (yellow). The orange circle indicates the current position of the
center of the tropical cyclone. The black line, when selected, and dots show the National Hurricane Center (NHC) forecast track of the center
at the times indicated. The dot indicating the forecast center location will be black if the cyclone is forecast to be
tropical and will be white with a black outline if the cyclone is forecast to be extratropical. If only an L is displayed,
then the system is forecast to be a remnant low. The letter inside the dot indicates the NHC’s forecast intensity for that time:
D: Tropical Depression – wind speed less than 39 MPH
S: Tropical Storm – wind speed between 39 MPH and 73 MPH
H: Hurricane – wind speed between 74 MPH and 110 MPH
M: Major Hurricane – wind speed greater than 110 MPH
NHC tropical cyclone forecast tracks can be in error. This forecast
uncertainty is conveyed by the track forecast “cone”, the solid white
and stippled white areas in the graphic. The solid white area depicts
the track forecast uncertainty for days 1-3 of the forecast, while the
stippled area depicts the uncertainty on days 4-5. Historical data
indicate that the entire 5-day path of the center of the tropical
cyclone will remain within the cone about 60-70% of the time. To
form the cone, a set of imaginary circles are placed along the
forecast track at the 12, 24, 36, 48, 72, 96, and 120 h positions,
where the size of each circle is set so that it encloses 67% of the
previous five years official forecast errors. The cone is then formed
by smoothly connecting the area swept out by the set of circles.
It is also important to realize that a tropical cyclone is not a point. Their
effects can span many hundreds of miles from the center. The area
experiencing hurricane force (one-minute average wind speeds of at least
74 mph) and tropical storm force (one-minute average wind speeds of
39-73 mph) winds can extend well beyond the white areas shown enclosing
the most likely track area of the center. The distribution of hurricane
and tropical storm force winds in this tropical cyclone can be seen in
the Wind History graphic linked above.
Considering the combined forecast uncertainties in track, intensity, and size, the
chances that any particular location will experience winds of 34 kt (tropical storm force),
50 kt, or 64 kt (hurricane force) from this tropical cyclone are presented in
tabular form for selected locations and forecast positions. This information is also presented in
graphical form for the 34 kt, 50 kt,
and 64 kt thresholds.
Note: A detailed definition of the NHC track forecast cone is also available.