
KMZ last updated Sat, 24 Sep 2022 21:10:23 GMT
Source link
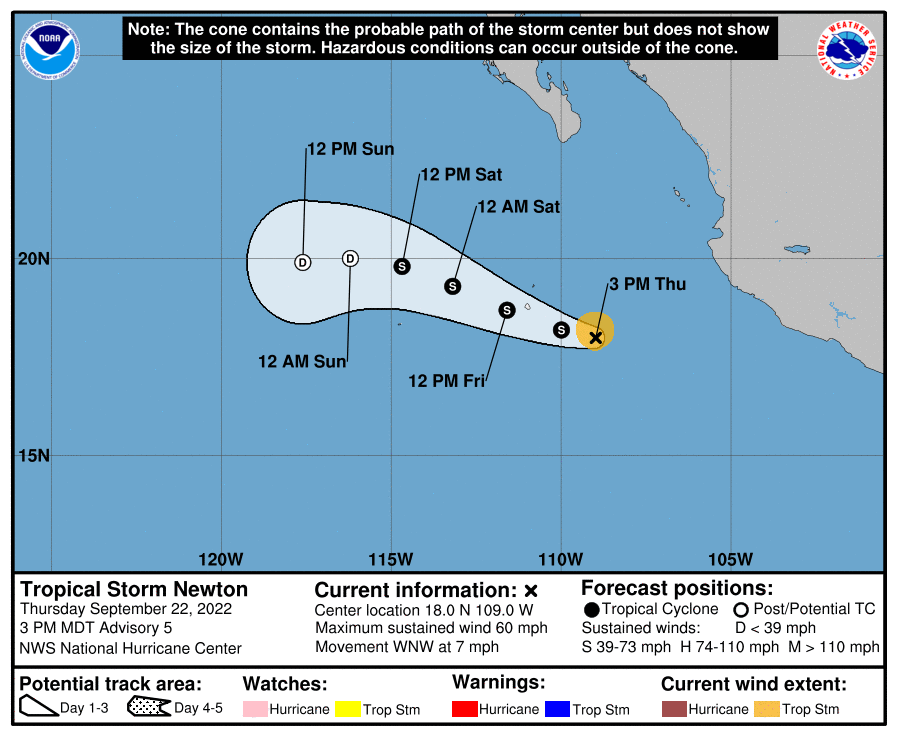
TROPICAL STORM NEWTON
TROPICAL STORM NEWTON
Coastal Watches/Warnings and Forecast Cone for Storm Center

* If the storm is forecast to dissipate within 3 days, the “Full Forecast” and “3 day” graphic will be identical
Click Here for a 5-day Cone Printer Friendly Graphic
How to use the cone graphic (video):

About this product:
This graphic shows an approximate representation of coastal areas under a hurricane warning (red), hurricane watch (pink),
tropical storm warning (blue) and tropical storm watch (yellow). The orange circle indicates the current position of the
center of the tropical cyclone. The black line, when selected, and dots show the National Hurricane Center (NHC) forecast track of the center
at the times indicated. The dot indicating the forecast center location will be black if the cyclone is forecast to be
tropical and will be white with a black outline if the cyclone is forecast to be extratropical. If only an L is displayed,
then the system is forecast to be a remnant low. The letter inside the dot indicates the NHC’s forecast intensity for that time:
D: Tropical Depression – wind speed less than 39 MPH
S: Tropical Storm – wind speed between 39 MPH and 73 MPH
H: Hurricane – wind speed between 74 MPH and 110 MPH
M: Major Hurricane – wind speed greater than 110 MPH
NHC tropical cyclone forecast tracks can be in error. This forecast
uncertainty is conveyed by the track forecast “cone”, the solid white
and stippled white areas in the graphic. The solid white area depicts
the track forecast uncertainty for days 1-3 of the forecast, while the
stippled area depicts the uncertainty on days 4-5. Historical data
indicate that the entire 5-day path of the center of the tropical
cyclone will remain within the cone about 60-70% of the time. To
form the cone, a set of imaginary circles are placed along the
forecast track at the 12, 24, 36, 48, 72, 96, and 120 h positions,
where the size of each circle is set so that it encloses 67% of the
previous five years official forecast errors. The cone is then formed
by smoothly connecting the area swept out by the set of circles.
It is also important to realize that a tropical cyclone is not a point. Their
effects can span many hundreds of miles from the center. The area
experiencing hurricane force (one-minute average wind speeds of at least
74 mph) and tropical storm force (one-minute average wind speeds of
39-73 mph) winds can extend well beyond the white areas shown enclosing
the most likely track area of the center. The distribution of hurricane
and tropical storm force winds in this tropical cyclone can be seen in
the Wind History graphic linked above.
Considering the combined forecast uncertainties in track, intensity, and size, the
chances that any particular location will experience winds of 34 kt (tropical storm force),
50 kt, or 64 kt (hurricane force) from this tropical cyclone are presented in
tabular form for selected locations and forecast positions. This information is also presented in
graphical form for the 34 kt, 50 kt,
and 64 kt thresholds.
Note: A detailed definition of the NHC track forecast cone is also available.
OpenStreetMap
OpenStreetMap is a map of the world, created by people like you and free to use under an open license.
Hosting is supported by UCL, Fastly, Bytemark Hosting, and other partners.
Learn More
Start Mapping
Hurricane Fiona Forecast Discussion
000
WTNT42 KNHC 202057
TCDAT2

Hurricane Fiona Discussion Number  26
NWS National Hurricane Center Miami FL       AL072022
500 PM EDT Tue Sep 20 2022

Deep convection around Fiona's eye is intense, but is in a rather
asymmetrical pattern at this time.  Upper-tropospheric outflow
remains somewhat restricted over the western semicircle of the
system.  The last Air Force Hurricane Hunter fix in the
center of the hurricane around 17Z showed a slight fall of
central pressure from earlier in the day, but the flight-level and
SFMR-observed surface winds indicated that the maximum winds were
still near 100 kt.  This is also in agreement with the latest
Dvorak satellite estimates from TAFB and SAB.  Another Air Force
Hurricane Hunter mission into Fiona is scheduled for 00Z to see if
Fiona is strengthening again.

Vertical wind shear over Fiona, as diagnosed by the SHIPS model, is
predicted to remain moderate for the next few days.  However, the
hurricane is likely to remain in a moist unstable air mass and over
a warm ocean for the next couple of days which is likely to offset
the influence of shear.  In general, the intensity model guidance
continues to show strengthening for about the next 48 hours, and so
does the official forecast.  Fiona is expected to become a category
4 hurricane in a day or so.  By 96 hours, global model guidance
indicates that the system will be transformed into a vigorous
extratropical cyclone near Atlantic Canada.

The hurricane is still headed toward the north-northwest with an
initial motion estimate of 330/7 kt.  The track forecast scenario
is generally unchanged from the previous advisory.  Fiona should
turn northward while moving along the western side of a mid-level
anticyclone during the next day or so.  In 2-3 days, an intense
mid-tropospheric trough will be moving off the northeast United
States coast.  This feature should cause Fiona to accelerate toward
the north-northeast and northeast during the latter part of the
forecast period.  The official forecast follows about the same
trajectory as the previous one, but is just a tad slower.  This is
in good agreement with both the simple and corrected consensus
predictions.


Key Messages:

1.  Heavy rains around the center of Fiona will continue to impact
the Turks and Caicos through this evening with continued
life-threatening flooding.  Localized additional flash and urban
flooding is possible in Puerto Rico and the Dominican Republic.

2. Hurricane conditions are affecting portions of the Turks and
Caicos islands, while tropical storm conditions should affect
portions of the southeastern Bahamas during the next few hours.

3. Tropical storm conditions are possible on Bermuda by late
Thursday.

4. Fiona is expected to affect portions of Atlantic Canada as a
powerful hurricane-force cyclone late Friday and Saturday, and could
produce significant impacts from high winds, storm surge, and heavy
rainfall. Interests in these areas should closely monitor the
progress of Fiona and updates to the forecast.


FORECAST POSITIONS AND MAX WINDS

INIT  20/2100Z 22.6N  71.8W  100 KT 115 MPH
 12H  21/0600Z 23.6N  72.0W  110 KT 125 MPH
 24H  21/1800Z 25.0N  71.9W  115 KT 130 MPH
 36H  22/0600Z 26.9N  71.3W  115 KT 130 MPH
 48H  22/1800Z 29.4N  70.1W  120 KT 140 MPH
 60H  23/0600Z 32.4N  67.8W  115 KT 130 MPH
 72H  23/1800Z 36.9N  63.5W  105 KT 120 MPH
 96H  24/1800Z 46.5N  60.0W   85 KT 100 MPH...POST-TROP/EXTRATROP
120H  25/1800Z 55.0N  58.0W   55 KT  65 MPH...POST-TROP/EXTRATROP

$$
Forecaster Pasch
OpenStreetMap
OpenStreetMap is a map of the world, created by people like you and free to use under an open license.
Hosting is supported by UCL, Fastly, Bytemark Hosting, and other partners.
Learn More
Start Mapping
Advisory #005 Forecast Track [kmz] – Tropical Storm Lester (EP3/EP132022)
KMZ last updated Fri, 16 Sep 2022 20:44:59 GMT
Source link
OpenStreetMap
OpenStreetMap is a map of the world, created by people like you and free to use under an open license.
Hosting is supported by UCL, Fastly, Bytemark Hosting, and other partners.
Learn More
Start Mapping
Advisory #001 Forecast Track [kmz] – Tropical Depression Seven (AT2/AL072022)
KMZ last updated Wed, 14 Sep 2022 15:03:47 GMT
Source link
OpenStreetMap
OpenStreetMap is a map of the world, created by people like you and free to use under an open license.
Hosting is supported by UCL, Fastly, Bytemark Hosting, and other partners.
Learn More
Start Mapping
Advisory #023A Forecast Track [kmz] – Hurricane Earl (AT1/AL062022)
KMZ last updated Thu, 08 Sep 2022 17:54:31 GMT
Source link