OpenStreetMap is a map of the world, created by people like you and free to use under an open license.
Hosting is supported by UCL, Fastly, Bytemark Hosting, and other partners.
Learn More
Start Mapping
OpenStreetMap is a map of the world, created by people like you and free to use under an open license.
Hosting is supported by UCL, Fastly, Bytemark Hosting, and other partners.
KMZ last updated Sat, 02 Oct 2021 02:46:57 GMT
Source link
481
WTNT43 KNHC 300256
TCDAT3

Hurricane Sam Discussion Number  30
NWS National Hurricane Center Miami FL       AL182021
1100 PM AST Wed Sep 29 2021

Sam is intensifying tonight after completing an eyewall replacement
cycle.  A recent NOAA Hurricane Hunter aircraft showed peak 700 mb
flight-level winds of 138 kt, multiple SFMR surface winds of 120 kt
or greater, plus falling central pressure to about 940 mb.  This
deepening trend is also seen on recent satellite imagery, with
significant warming within the eye noted.  These data support
raising the initial intensity to 125 kt for this advisory.  It is
of note that the NOAA mission has been quite helpful for both the
size and intensity analysis, with dropsondes and SFMR data showing
that the hurricane has grown quite a bit since earlier today,
mostly on the eastern side.  Additionally, reflectivity data
from the core confirmed the end of the eyewall replacement cycle.

The hurricane could strengthen a little more overnight while it
moves over a warm ocean eddy in fairly light shear.  Afterward,
gradually cooling SSTs, falling ocean heat content, and the
inevitable future eyewall replacement cycles should cause a
weakening trend.  However, this will likely not be as steady as
shown below, and significant deviations (upward or downward) from
the forecast can be expected.  Faster weakening is expected by the
weekend due to cool SSTs and increasing shear.  The new forecast is
close to the intensity consensus, and is a little higher than the
previous NHC prediction early on, primarily due to the initial wind
speed.

Sam has sped up tonight, now estimated at 315/10 kt.  It sounds like
a broken record, but there are no changes to the forecast during the
first few days as model guidance is in excellent agreement on a
gradually rightward-curving track, passing a couple of hundred n mi
or more east of Bermuda.  Afterward, guidance is actually in worse
agreement over the weekend, with widely divergent solutions from an
upper-level trough picking up Sam and turning it north toward
Newfoundland or the trough leaving Sam behind, causing a slow
eastward motion.  The trend in the guidance is for a slower motion
at long range, so I've elected to keep the day 4 and 5 points almost
the same as the previous advisory, just a hair faster than the
latest consensus aids.


Key Messages:

1. Swells generated by Sam will impact the Lesser Antilles during
the next several days.  Swells are expected to reach Bermuda
and the Bahamas in a day or so, and then spread to the United
States east coast by this weekend.  These swells could cause
life-threatening surf and rip current conditions.  Please consult
products from your local weather office.

2. A Tropical Storm Watch could be required for Bermuda on
Thursday, and interests there should monitor the progress of Sam.


FORECAST POSITIONS AND MAX WINDS

INIT  30/0300Z 20.6N  58.4W  125 KT 145 MPH
 12H  30/1200Z 21.9N  59.6W  130 KT 150 MPH
 24H  01/0000Z 24.1N  60.9W  125 KT 145 MPH
 36H  01/1200Z 26.8N  61.8W  120 KT 140 MPH
 48H  02/0000Z 29.6N  61.8W  115 KT 130 MPH
 60H  02/1200Z 32.2N  60.7W  110 KT 125 MPH
 72H  03/0000Z 34.3N  59.2W  100 KT 115 MPH
 96H  04/0000Z 37.5N  54.5W   85 KT 100 MPH
120H  05/0000Z 42.0N  48.5W   70 KT  80 MPH

$$
Forecaster Blake
OpenStreetMap is a map of the world, created by people like you and free to use under an open license.
Hosting is supported by UCL, Fastly, Bytemark Hosting, and other partners.
OpenStreetMap is a map of the world, created by people like you and free to use under an open license.
Hosting is supported by UCL, Fastly, Bytemark Hosting, and other partners.
KMZ last updated Sun, 26 Sep 2021 02:53:44 GMT
Source link
OpenStreetMap is a map of the world, created by people like you and free to use under an open license.
Hosting is supported by UCL, Fastly, Bytemark Hosting, and other partners.

* If the storm is forecast to dissipate within 3 days, the “Full Forecast” and “3 day” graphic will be identical
Click Here for a 5-day Cone Printer Friendly Graphic

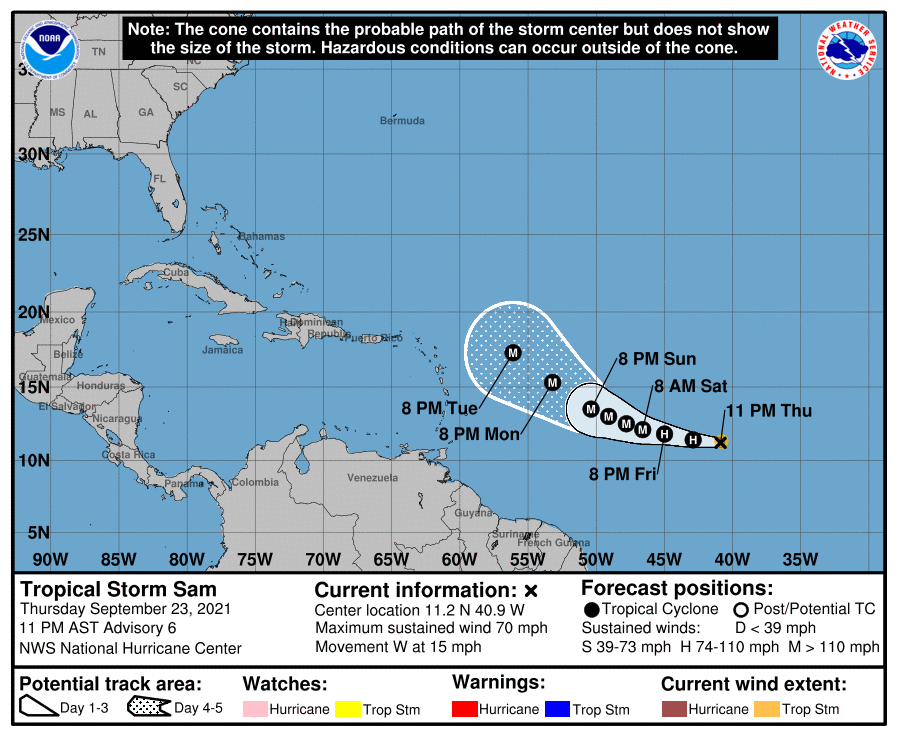
This graphic shows an approximate representation of coastal areas under a hurricane warning (red), hurricane watch (pink),
tropical storm warning (blue) and tropical storm watch (yellow). The orange circle indicates the current position of the
center of the tropical cyclone. The black line, when selected, and dots show the National Hurricane Center (NHC) forecast track of the center
at the times indicated. The dot indicating the forecast center location will be black if the cyclone is forecast to be
tropical and will be white with a black outline if the cyclone is forecast to be extratropical. If only an L is displayed,
then the system is forecast to be a remnant low. The letter inside the dot indicates the NHC’s forecast intensity for that time:
D: Tropical Depression – wind speed less than 39 MPH
S: Tropical Storm – wind speed between 39 MPH and 73 MPH
H: Hurricane – wind speed between 74 MPH and 110 MPH
M: Major Hurricane – wind speed greater than 110 MPH
NHC tropical cyclone forecast tracks can be in error. This forecast
uncertainty is conveyed by the track forecast “cone”, the solid white
and stippled white areas in the graphic. The solid white area depicts
the track forecast uncertainty for days 1-3 of the forecast, while the
stippled area depicts the uncertainty on days 4-5. Historical data
indicate that the entire 5-day path of the center of the tropical
cyclone will remain within the cone about 60-70% of the time. To
form the cone, a set of imaginary circles are placed along the
forecast track at the 12, 24, 36, 48, 72, 96, and 120 h positions,
where the size of each circle is set so that it encloses 67% of the
previous five years official forecast errors. The cone is then formed
by smoothly connecting the area swept out by the set of circles.
It is also important to realize that a tropical cyclone is not a point. Their
effects can span many hundreds of miles from the center. The area
experiencing hurricane force (one-minute average wind speeds of at least
74 mph) and tropical storm force (one-minute average wind speeds of
39-73 mph) winds can extend well beyond the white areas shown enclosing
the most likely track area of the center. The distribution of hurricane
and tropical storm force winds in this tropical cyclone can be seen in
the Wind History graphic linked above.
Considering the combined forecast uncertainties in track, intensity, and size, the
chances that any particular location will experience winds of 34 kt (tropical storm force),
50 kt, or 64 kt (hurricane force) from this tropical cyclone are presented in
tabular form for selected locations and forecast positions. This information is also presented in
graphical form for the 34 kt, 50 kt,
and 64 kt thresholds.
Note: A detailed definition of the NHC track forecast cone is also available.
OpenStreetMap is a map of the world, created by people like you and free to use under an open license.
Hosting is supported by UCL, Fastly, Bytemark Hosting, and other partners.
KMZ last updated Mon, 20 Sep 2021 02:53:07 GMT
Source link