
Earthquake: 2021-07-18 04:56HKT M6.1 [6.9N, 82.6W] south of Panama http://openstreetmap.org/?mlat=6.9&mlon=-82.6.
Source link
Advisory #003 Forecast Track [kmz] – Tropical Storm Guillermo (EP2/EP072021)
KMZ last updated Sun, 18 Jul 2021 02:39:50 GMT
Source link
Hurricane Felicia Forecast Discussion
000
WTPZ41 KNHC 160253
TCDEP1

Hurricane Felicia Discussion Number   8
NWS National Hurricane Center Miami FL       EP062021
800 PM PDT Thu Jul 15 2021

Satellite imagery indicates that Felicia has continued to rapidly
strengthen this evening. Infrared temperatures have significantly
warmed within the eye during the past couple hours, and deep
convection within the eyewall has become more symmetric. A closed
ring of infrared cloud top temperatures colder than -65 to -70 deg
Celsius now completely surrounds the eye of Felicia. Based on these
current satellite trends, the initial intensity is raised to 95 kt
for this advisory. This lies between the TAFB subjective Dvorak
current intensity estimate of 90 kt and UW-CIMSS ADT objective
estimates of around 100 kt.

Warm sea-surface temperatures and low vertical wind shear along
Felicia's forecast track are expected to allow for some additional
strengthening in the short-term, especially since dry air in the
surrounding environment has had minimal impact on the cyclone's
intensification up to this point. The official NHC intensity
forecast has been adjusted upward and now brings Felicia to major
hurricane status (Category 3 on the Saffir-Simpson Hurricane Wind
Scale) within 12 h. The NHC forecast remains higher than the
guidance consensus through the first 72 h, then generally follows
the HFIP corrected consensus approach (HCCA) thereafter. The cyclone
is forecast to slowly weaken this weekend within a drier, more
stable mid-level environment. However, the forecast track keeps
Felicia south of the 26 deg C isotherm, which should allow the
cyclone to maintain its hurricane intensity through much of the
forecast period.

Felicia is still moving almost due west at around 8 kt. As the
steering ridge becomes positioned to the northwest of Felicia, the
cyclone is expected to move west-southwestward during the next day
or so. Then, Felicia is forecast to resume a more westward motion
for the next several days as the cyclone moves to the south of a
subtropical ridge. The track guidance remains tightly clustered
through much of the period. The official NHC forecast is adjusted
just a bit slower and slightly farther north than the previous one,
bringing it closer to the usually reliable consensus aids TVCE and
HCCA.


FORECAST POSITIONS AND MAX WINDS

INIT  16/0300Z 15.2N 120.2W   95 KT 110 MPH
 12H  16/1200Z 15.1N 121.3W  110 KT 125 MPH
 24H  17/0000Z 14.9N 122.6W  105 KT 120 MPH
 36H  17/1200Z 14.7N 124.2W   95 KT 110 MPH
 48H  18/0000Z 14.7N 126.0W   90 KT 105 MPH
 60H  18/1200Z 14.9N 127.8W   85 KT 100 MPH
 72H  19/0000Z 15.0N 129.7W   80 KT  90 MPH
 96H  20/0000Z 14.9N 133.3W   65 KT  75 MPH
120H  21/0000Z 14.5N 137.0W   60 KT  70 MPH

$$
Forecaster Reinhart/Blake
Quick Earthquake Messages M6.2 [2.9N, 126.6E] over Northern Molucca Sea (08:44 HKT 10/07/2021)
Earthquake: 2021-07-10 08:44HKT M6.2 [2.9N, 126.6E] over Northern Molucca Sea http://openstreetmap.org/?mlat=2.9&mlon=126.6.
Source link
Local Statement for Elsa (Boston, MA)
000
WTUS81 KBOX 092101
HLSBOX
CTZ002>004-MAZ002>024-026-RIZ001>008-100515-

Post-Tropical Cyclone Elsa Local Statement Advisory Number 39
National Weather Service Boston/Norton MA  AL052021
501 PM EDT Fri Jul 9 2021

This product covers Southern New England

**Elsa Has Moved Away - All Tropical Warnings Have Been Cancelled**


NEW INFORMATION
---------------

* CHANGES TO WATCHES AND WARNINGS:
    - All watches and warnings have been canceled

* CURRENT WATCHES AND WARNINGS:
    - None

* STORM INFORMATION:
    - About 90 miles east-northeast of Boston MA
    - 43.0N 69.5W
    - Storm Intensity 50 mph
    - Movement Northeast or 45 degrees at 35 mph

SITUATION OVERVIEW
------------------

Elsa has moved off to the east, with improving conditions this
evening.

POTENTIAL IMPACTS
-----------------

* FLOODING RAIN:
Little to no rainfall is expected, however many rivers will continue to
rise, with generally minor flooding expected.

* WIND:
Little to no additional impacts are anticipated at this time across
Southern New England.

PRECAUTIONARY/PREPAREDNESS ACTIONS
----------------------------------

Do not enter flooded areas unless officials have given the all clear
to return.

NEXT UPDATE
-----------

As it pertains to this event...this will be the last local statement
issued by the National Weather Service in Boston/Norton MA regarding
the effects of tropical cyclone hazards upon the area.

$$
Nash
Advisory #023 Forecast Track [kmz] – Tropical Storm Elsa (AT5/AL052021)
KMZ last updated Tue, 06 Jul 2021 02:53:55 GMT
Source link
TROPICAL STORM ELSA
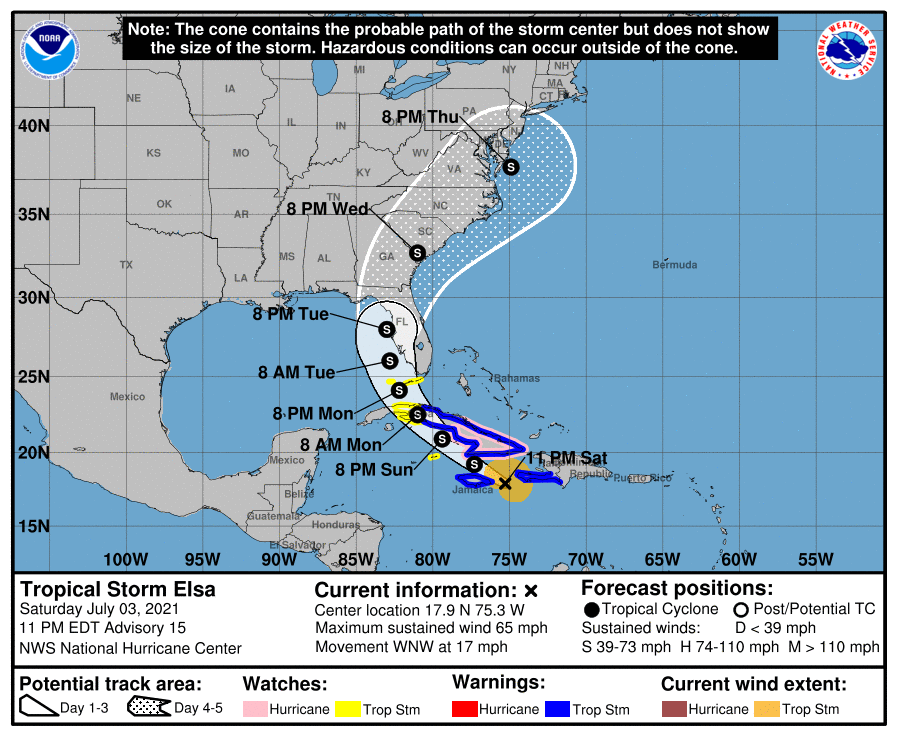
TROPICAL STORM ELSA
Coastal Watches/Warnings and Forecast Cone for Storm Center

* If the storm is forecast to dissipate within 3 days, the “Full Forecast” and “3 day” graphic will be identical
Click Here for a 5-day Cone Printer Friendly Graphic
How to use the cone graphic (video):

About this product:
This graphic shows an approximate representation of coastal areas under a hurricane warning (red), hurricane watch (pink),
tropical storm warning (blue) and tropical storm watch (yellow). The orange circle indicates the current position of the
center of the tropical cyclone. The black line, when selected, and dots show the National Hurricane Center (NHC) forecast track of the center
at the times indicated. The dot indicating the forecast center location will be black if the cyclone is forecast to be
tropical and will be white with a black outline if the cyclone is forecast to be extratropical. If only an L is displayed,
then the system is forecast to be a remnant low. The letter inside the dot indicates the NHC’s forecast intensity for that time:
D: Tropical Depression – wind speed less than 39 MPH
S: Tropical Storm – wind speed between 39 MPH and 73 MPH
H: Hurricane – wind speed between 74 MPH and 110 MPH
M: Major Hurricane – wind speed greater than 110 MPH
NHC tropical cyclone forecast tracks can be in error. This forecast
uncertainty is conveyed by the track forecast “cone”, the solid white
and stippled white areas in the graphic. The solid white area depicts
the track forecast uncertainty for days 1-3 of the forecast, while the
stippled area depicts the uncertainty on days 4-5. Historical data
indicate that the entire 5-day path of the center of the tropical
cyclone will remain within the cone about 60-70% of the time. To
form the cone, a set of imaginary circles are placed along the
forecast track at the 12, 24, 36, 48, 72, 96, and 120 h positions,
where the size of each circle is set so that it encloses 67% of the
previous five years official forecast errors. The cone is then formed
by smoothly connecting the area swept out by the set of circles.
It is also important to realize that a tropical cyclone is not a point. Their
effects can span many hundreds of miles from the center. The area
experiencing hurricane force (one-minute average wind speeds of at least
74 mph) and tropical storm force (one-minute average wind speeds of
39-73 mph) winds can extend well beyond the white areas shown enclosing
the most likely track area of the center. The distribution of hurricane
and tropical storm force winds in this tropical cyclone can be seen in
the Wind History graphic linked above.
Considering the combined forecast uncertainties in track, intensity, and size, the
chances that any particular location will experience winds of 34 kt (tropical storm force),
50 kt, or 64 kt (hurricane force) from this tropical cyclone are presented in
tabular form for selected locations and forecast positions. This information is also presented in
graphical form for the 34 kt, 50 kt,
and 64 kt thresholds.
Note: A detailed definition of the NHC track forecast cone is also available.
Tropical Storm Enrique Public Advisory
277
WTPZ35 KNHC 300241
TCPEP5

BULLETIN
Tropical Storm Enrique Advisory Number  20
NWS National Hurricane Center Miami FL       EP052021
900 PM MDT Tue Jun 29 2021

...TINY ENRIQUE HANGING ON TO TROPICAL CYCLONE STATUS WHILE MOVING
INTO THE GULF OF CALIFORNIA...


SUMMARY OF 900 PM MDT...0300 UTC...INFORMATION
----------------------------------------------
LOCATION...23.8N 109.1W
ABOUT 80 MI...130 KM NE OF CABO SAN LUCAS MEXICO
MAXIMUM SUSTAINED WINDS...40 MPH...65 KM/H
PRESENT MOVEMENT...NW OR 315 DEGREES AT 12 MPH...19 KM/H
MINIMUM CENTRAL PRESSURE...1003 MB...29.62 INCHES


WATCHES AND WARNINGS
--------------------
There are no coastal watches or warnings in effect.


DISCUSSION AND OUTLOOK
----------------------
At 900 PM MDT (0300 UTC), the center of Tropical Storm Enrique was
located near latitude 23.8 North, longitude 109.1 West. Enrique is
moving toward the northwest near 12 mph (19 km/h) and this motion is
expected to continue for the next day or so followed by a slight
turn to the left.

Maximum sustained winds remain near 40 mph (65 km/h) with higher
gusts. Enrique is expected to weaken to a tropical depression
tomorrow and dissipate on Thursday near the Baja California
Peninsula.

Tropical-storm-force winds extend outward up to 35 miles (55 km)
from the center.

The estimated minimum central pressure is 1003 mb (29.62 inches).


HAZARDS AFFECTING LAND
----------------------
Key messages for Enrique can be found in the Tropical Cyclone
Discussion under AWIPS header MIATCDEP5, WMO header WTPZ45
KNHC, and on the web at
www.hurricanes.gov/graphics_ep5.shtml?key_messages.

RAINFALL: Enrique is expected to produce additional rainfall totals
of 2 to 4 inches with maximum amounts of 6 inches across Sinaola,
western Durango and southern Chihuahua in western Mexico and 1 to 2
inches with maximum amounts of 4 inches across the southern portions
of Baja California Sur.  These rainfall totals may trigger flash
flooding and mudslides.

SURF:  Swells generated by Enrique will affect the southwestern
coast of Mexico, as well as portions of the Gulf of California and
the coast of the southern Baja California Peninsula during the next
day or so. These swells are likely to cause life-threatening surf
and rip current conditions. Please consult products from your local
weather office.


NEXT ADVISORY
-------------
Next complete advisory at 300 AM MDT.

$$
Forecaster Papin/Cangialosi
HURRICANE ENRIQUE
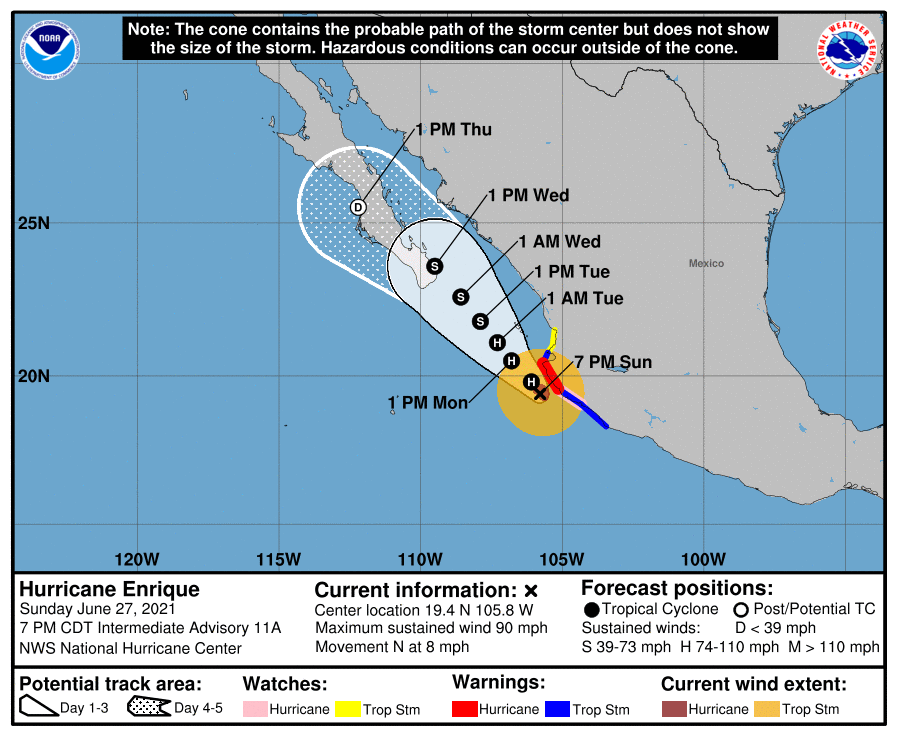
HURRICANE ENRIQUE
Coastal Watches/Warnings and Forecast Cone for Storm Center

* If the storm is forecast to dissipate within 3 days, the “Full Forecast” and “3 day” graphic will be identical
Click Here for a 5-day Cone Printer Friendly Graphic
How to use the cone graphic (video):
About this product:
This graphic shows an approximate representation of coastal areas under a hurricane warning (red), hurricane watch (pink),
tropical storm warning (blue) and tropical storm watch (yellow). The orange circle indicates the current position of the
center of the tropical cyclone. The black line, when selected, and dots show the National Hurricane Center (NHC) forecast track of the center
at the times indicated. The dot indicating the forecast center location will be black if the cyclone is forecast to be
tropical and will be white with a black outline if the cyclone is forecast to be extratropical. If only an L is displayed,
then the system is forecast to be a remnant low. The letter inside the dot indicates the NHC’s forecast intensity for that time:
D: Tropical Depression – wind speed less than 39 MPH
S: Tropical Storm – wind speed between 39 MPH and 73 MPH
H: Hurricane – wind speed between 74 MPH and 110 MPH
M: Major Hurricane – wind speed greater than 110 MPH
NHC tropical cyclone forecast tracks can be in error. This forecast
uncertainty is conveyed by the track forecast “cone”, the solid white
and stippled white areas in the graphic. The solid white area depicts
the track forecast uncertainty for days 1-3 of the forecast, while the
stippled area depicts the uncertainty on days 4-5. Historical data
indicate that the entire 5-day path of the center of the tropical
cyclone will remain within the cone about 60-70% of the time. To
form the cone, a set of imaginary circles are placed along the
forecast track at the 12, 24, 36, 48, 72, 96, and 120 h positions,
where the size of each circle is set so that it encloses 67% of the
previous five years official forecast errors. The cone is then formed
by smoothly connecting the area swept out by the set of circles.
It is also important to realize that a tropical cyclone is not a point. Their
effects can span many hundreds of miles from the center. The area
experiencing hurricane force (one-minute average wind speeds of at least
74 mph) and tropical storm force (one-minute average wind speeds of
39-73 mph) winds can extend well beyond the white areas shown enclosing
the most likely track area of the center. The distribution of hurricane
and tropical storm force winds in this tropical cyclone can be seen in
the Wind History graphic linked above.
Considering the combined forecast uncertainties in track, intensity, and size, the
chances that any particular location will experience winds of 34 kt (tropical storm force),
50 kt, or 64 kt (hurricane force) from this tropical cyclone are presented in
tabular form for selected locations and forecast positions. This information is also presented in
graphical form for the 34 kt, 50 kt,
and 64 kt thresholds.
Note: A detailed definition of the NHC track forecast cone is also available.
Strong Earthquake Report M6.0 [12.6S, 76.6W] near coast of Peru (11:20 HKT 23/06/2021)
Earthquake: 2021-06-23 10:54HKT M6.0 [12.6S, 76.6W] near coast of Peru http://openstreetmap.org/?mlat=-12.6&mlon=-76.6.
Source link