Welcome to OpenStreetMap!
OpenStreetMap is a map of the world, created by people like you and free to use under an open license.
Hosting is supported by UCL, Bytemark Hosting, and other partners.
Learn More
Start Mapping
Start Mapping
OpenStreetMap is a map of the world, created by people like you and free to use under an open license.
Hosting is supported by UCL, Bytemark Hosting, and other partners.
437
WTUS84 KLIX 241840
HLSLIX
LAZ034>037-039-040-046>050-056>072-MSZ068>071-077-080>082-250245-

Tropical Storm Marco Local Statement Special Advisory Number 18
National Weather Service New Orleans LA  AL142020
140 PM CDT Mon Aug 24 2020

This product covers Southeast Louisiana and South Mississippi

**Watches and Warnings Will Be Issued Later This Afternoon for
Laura**


NEW INFORMATION
---------------

* CHANGES TO WATCHES AND WARNINGS:
    - Watches and Warnings Will Be Issued Later This Afternoon for
      Laura

* CURRENT WATCHES AND WARNINGS:
    - None

* STORM INFORMATION:
    - About 130 miles southeast of New Orleans LA or about 120 miles
      south-southeast of Gulfport MS
    - 28.7N 88.6W
    - Storm Intensity 40 mph
    - Movement Northwest or 320 degrees at 6 mph

SITUATION OVERVIEW
------------------

Tropical Storm Marco has weakened however our focus now turns to
Tropical Storm Laura. Products for Laura will be issued later this
afternoon. Stay vigilant and complete any preparations for Laura's
potential impacts.

POTENTIAL IMPACTS
-----------------

* SURGE:
Minor coastal flooding is ongoing and watches or warnings will be
for Laura will be issued later this afternoon.

PRECAUTIONARY/PREPAREDNESS ACTIONS
----------------------------------

* EVACUATIONS:

Updates provided later this afternoon.

* OTHER PREPAREDNESS INFORMATION:

Updates provided later this afternoon.

* ADDITIONAL SOURCES OF INFORMATION:
- For information on appropriate preparations see ready.gov
- For information on creating an emergency plan see getagameplan.org
- For additional disaster preparedness information see redcross.org

NEXT UPDATE
-----------

The next local statement will be issued by the National Weather
Service in New Orleans LA for Laura will be sent by 5
PM CDT, or sooner if conditions warrant.

$$
OpenStreetMap is a map of the world, created by people like you and free to use under an open license.
Hosting is supported by UCL, Bytemark Hosting, and other partners.
KMZ last updated Thu, 20 Aug 2020 18:06:38 GMT
Source link
OpenStreetMap is a map of the world, created by people like you and free to use under an open license.
Hosting is supported by UCL, Bytemark Hosting, and other partners.
Learn More
Start Mapping

* If the storm is forecast to dissipate within 3 days, the “Full Forecast” and “3 day” graphic will be identical
Click Here for a 5-day Cone Printer Friendly Graphic

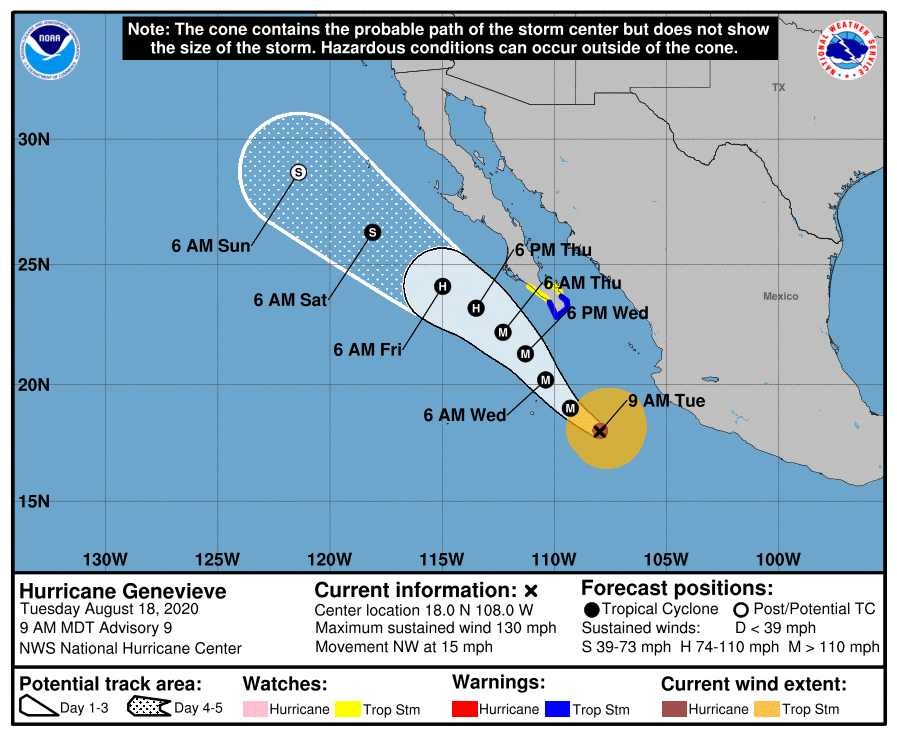
This graphic shows an approximate representation of coastal areas under a hurricane warning (red), hurricane watch (pink),
tropical storm warning (blue) and tropical storm watch (yellow). The orange circle indicates the current position of the
center of the tropical cyclone. The black line, when selected, and dots show the National Hurricane Center (NHC) forecast track of the center
at the times indicated. The dot indicating the forecast center location will be black if the cyclone is forecast to be
tropical and will be white with a black outline if the cyclone is forecast to be extratropical. If only an L is displayed,
then the system is forecast to be a remnant low. The letter inside the dot indicates the NHC’s forecast intensity for that time:
D: Tropical Depression – wind speed less than 39 MPH
S: Tropical Storm – wind speed between 39 MPH and 73 MPH
H: Hurricane – wind speed between 74 MPH and 110 MPH
M: Major Hurricane – wind speed greater than 110 MPH
NHC tropical cyclone forecast tracks can be in error. This forecast
uncertainty is conveyed by the track forecast “cone”, the solid white
and stippled white areas in the graphic. The solid white area depicts
the track forecast uncertainty for days 1-3 of the forecast, while the
stippled area depicts the uncertainty on days 4-5. Historical data
indicate that the entire 5-day path of the center of the tropical
cyclone will remain within the cone about 60-70% of the time. To
form the cone, a set of imaginary circles are placed along the
forecast track at the 12, 24, 36, 48, 72, 96, and 120 h positions,
where the size of each circle is set so that it encloses 67% of the
previous five years official forecast errors. The cone is then formed
by smoothly connecting the area swept out by the set of circles.
It is also important to realize that a tropical cyclone is not a point. Their
effects can span many hundreds of miles from the center. The area
experiencing hurricane force (one-minute average wind speeds of at least
74 mph) and tropical storm force (one-minute average wind speeds of
39-73 mph) winds can extend well beyond the white areas shown enclosing
the most likely track area of the center. The distribution of hurricane
and tropical storm force winds in this tropical cyclone can be seen in
the Wind History graphic linked above.
Considering the combined forecast uncertainties in track, intensity, and size, the
chances that any particular location will experience winds of 34 kt (tropical storm force),
50 kt, or 64 kt (hurricane force) from this tropical cyclone are presented in
tabular form for selected locations and forecast positions. This information is also presented in
graphical form for the 34 kt, 50 kt,
and 64 kt thresholds.
Note: A detailed definition of the NHC track forecast cone is also available.
712
WTPZ35 KNHC 141432
TCPEP5

BULLETIN
Tropical Depression Ten-E Advisory Number   6
NWS National Hurricane Center Miami FL       EP102020
800 AM PDT Fri Aug 14 2020

...DEPRESSION PERSISTS FOR NOW...


SUMMARY OF 800 AM PDT...1500 UTC...INFORMATION
----------------------------------------------
LOCATION...13.6N 131.9W
ABOUT 1575 MI...2535 KM WSW OF THE SOUTHERN TIP OF BAJA CALIFORNIA
MAXIMUM SUSTAINED WINDS...35 MPH...55 KM/H
PRESENT MOVEMENT...WSW OR 245 DEGREES AT 6 MPH...9 KM/H
MINIMUM CENTRAL PRESSURE...1004 MB...29.65 INCHES


WATCHES AND WARNINGS
--------------------
There are no coastal watches or warnings in effect.


DISCUSSION AND OUTLOOK
----------------------
At 800 AM PDT (1500 UTC), the center of Tropical Depression Ten-E
was located near latitude 13.6 North, longitude 131.9 West. The
depression is moving toward the west-southwest near 6 mph (9 km/h).
A slow drift toward the west-southwest is expected today, followed
by a turn toward the northwest over the weekend.

Maximum sustained winds are near 35 mph (55 km/h) with higher gusts.
Little change in strength is forecast during the next few days.

The estimated minimum central pressure is 1004 mb (29.65 inches).


HAZARDS AFFECTING LAND
----------------------
None


NEXT ADVISORY
-------------
Next complete advisory at 200 PM PDT.

$$
Forecaster Zelinsky
OpenStreetMap is a map of the world, created by people like you and free to use under an open license.
Hosting is supported by UCL, Bytemark Hosting, and other partners.
Learn More
Start Mapping
KMZ last updated Wed, 12 Aug 2020 08:51:48 GMT
Source link
000
WTPZ44 KNHC 100851
TCDEP4

Tropical Storm Elida Discussion Number   6
NWS National Hurricane Center Miami FL       EP092020
300 AM MDT Mon Aug 10 2020

After the earlier burst of deep convection and the development of a
small 10-nmi-wide low- to mid-level eye noted in passive microwave
satellite imagery, convection has waned somewhat and the eye feature
has eroded in the northwestern semicircle due to entrainment of dry
air, along with some modest northwesterly vertical wind shear. A
0314Z ASCAT-A overpass revealed peak winds of only 43 kt in the
northeastern quadrant, along with a radius of maximum winds (RMW)
of 10-15 nmi. Satellite intensity estimates range from T3.5/55 kt
from TAFB to T4.0/65 kt from SAB, along with a UW-CIMSS SATCON
estimate of 53 kt and an ADT estimate of 59 kt. An average of these
intensity estimates, and allowing for some undersampling by the
scatterometer instrument due to Elida's small RMW, supports
maintaining an intensity of 55 kt for this advisory.

The initial motion estimate remains west-northwestward or 300/13 kt.
Both the forecast track and rationale remain straight-forward and
basically unchanged from the previous advisory. Elida is expected to
be steered west-northwestward by a deep layer ridge to the north for
the next 72 hours or, followed by a westward motion on days 4 and 5
when Elida will be weakening over much cooler waters and becoming a
shallower cyclone. The latest NHC track guidance remains tightly
packed and, thus, the new official forecast is very similar to the
previous advisory track, and lies near the TVCE and NOAA-HCCA
consensus track models.

The brief intensity hiatus that Elida is experiencing is expected
to be short-lived due to the cyclone's small RMW and the vertical
shear forecast to decrease to less than 10 kt in the 12-36 hour
time frame. This should allow for Elida to strengthen -- possibly
even rapidly -- during the next 24 hours, followed by a leveling
off in the intensity due to the cyclone moving over sub-26C
sea-surface temperatures (SST).  By 48-60 h, SSTs less than 25C and
modest southwesterly vertical wind shear will combine to induce
steady weakening. By 96 h or so, Elida is forecast to degenerate
into a post-tropical cyclone. The new official intensity forecast is
a little lower than the previous advisory, but is a little above
the consensus models IVCN and HCCA.


FORECAST POSITIONS AND MAX WINDS

INIT  10/0900Z 18.3N 108.8W   55 KT  65 MPH
 12H  10/1800Z 19.1N 110.8W   65 KT  75 MPH
 24H  11/0600Z 20.0N 113.5W   75 KT  85 MPH
 36H  11/1800Z 20.8N 116.2W   80 KT  90 MPH
 48H  12/0600Z 21.5N 118.6W   65 KT  75 MPH
 60H  12/1800Z 22.2N 120.7W   55 KT  65 MPH
 72H  13/0600Z 22.6N 122.6W   45 KT  50 MPH
 96H  14/0600Z 22.2N 125.7W   35 KT  40 MPH...POST-TROPICAL
120H  15/0600Z 21.4N 128.8W   25 KT  30 MPH...POST-TROP/REMNT LOW

$$
Forecaster Stewart