
Earthquake: 2021-08-18 18:10HKT M7.1 [14.9S, 166.9E] near Vanuatu Islands http://openstreetmap.org/?mlat=-14.9&mlon=166.9.
Source link
Quick Earthquake Messages M6.9 [58.7S, 23.7W] in South Sandwich Islands Region (19:11 HKT 16/08/2021)
Earthquake: 2021-08-16 19:11HKT M6.9 [58.7S, 23.7W] in South Sandwich Islands Region http://openstreetmap.org/?mlat=-58.7&mlon=-23.7.
Source link
Advisory #027 Forecast Track [kmz] – Hurricane Linda (EP2/EP122021)
KMZ last updated Mon, 16 Aug 2021 20:49:55 GMT
Source link
Quick Earthquake Messages M7.0 [18.6N, 73.6W] in Haiti Region (20:29 HKT 14/08/2021)
Earthquake: 2021-08-14 20:29HKT M7.0 [18.6N, 73.6W] in Haiti Region http://openstreetmap.org/?mlat=18.6&mlon=-73.6.
Source link
Advisory #006A Watches/Warnings [kmz] – Tropical Storm Grace (AT2/AL072021)
KMZ last updated Sat, 14 Aug 2021 23:59:20 GMT
Source link
Quick Earthquake Messages M6.0 [60.0S, 26.5W] in South Sandwich Islands Region (03:44 HKT 13/08/2021)
Earthquake: 2021-08-13 03:44HKT M6.0 [60.0S, 26.5W] in South Sandwich Islands Region http://openstreetmap.org/?mlat=-60&mlon=-26.5.
Source link
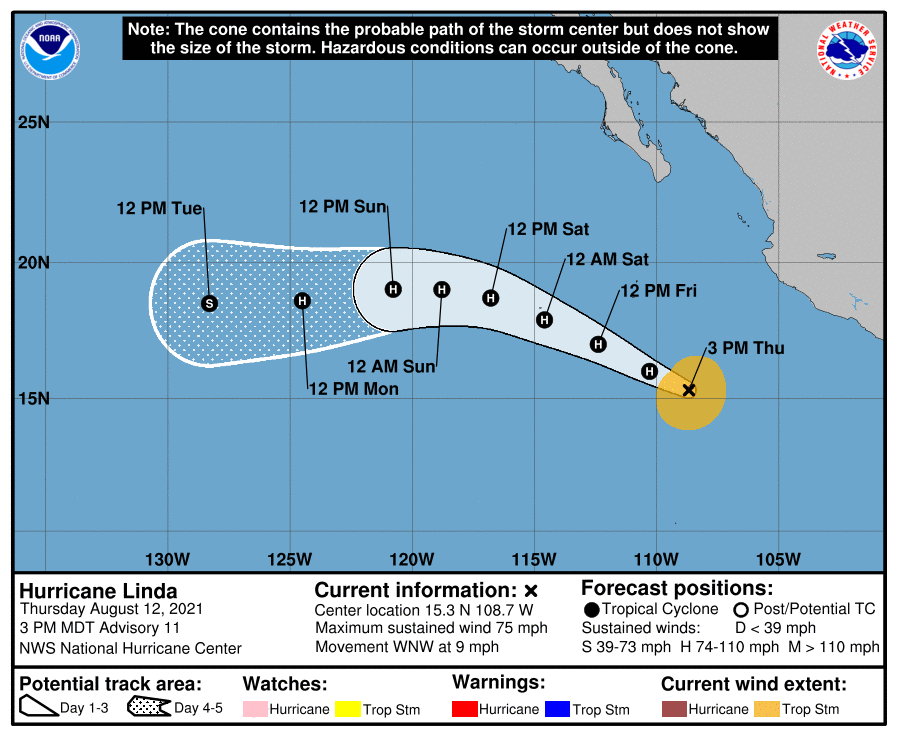
HURRICANE LINDA
HURRICANE LINDA
Coastal Watches/Warnings and Forecast Cone for Storm Center

* If the storm is forecast to dissipate within 3 days, the “Full Forecast” and “3 day” graphic will be identical
Click Here for a 5-day Cone Printer Friendly Graphic
How to use the cone graphic (video):

About this product:
This graphic shows an approximate representation of coastal areas under a hurricane warning (red), hurricane watch (pink),
tropical storm warning (blue) and tropical storm watch (yellow). The orange circle indicates the current position of the
center of the tropical cyclone. The black line, when selected, and dots show the National Hurricane Center (NHC) forecast track of the center
at the times indicated. The dot indicating the forecast center location will be black if the cyclone is forecast to be
tropical and will be white with a black outline if the cyclone is forecast to be extratropical. If only an L is displayed,
then the system is forecast to be a remnant low. The letter inside the dot indicates the NHC’s forecast intensity for that time:
D: Tropical Depression – wind speed less than 39 MPH
S: Tropical Storm – wind speed between 39 MPH and 73 MPH
H: Hurricane – wind speed between 74 MPH and 110 MPH
M: Major Hurricane – wind speed greater than 110 MPH
NHC tropical cyclone forecast tracks can be in error. This forecast
uncertainty is conveyed by the track forecast “cone”, the solid white
and stippled white areas in the graphic. The solid white area depicts
the track forecast uncertainty for days 1-3 of the forecast, while the
stippled area depicts the uncertainty on days 4-5. Historical data
indicate that the entire 5-day path of the center of the tropical
cyclone will remain within the cone about 60-70% of the time. To
form the cone, a set of imaginary circles are placed along the
forecast track at the 12, 24, 36, 48, 72, 96, and 120 h positions,
where the size of each circle is set so that it encloses 67% of the
previous five years official forecast errors. The cone is then formed
by smoothly connecting the area swept out by the set of circles.
It is also important to realize that a tropical cyclone is not a point. Their
effects can span many hundreds of miles from the center. The area
experiencing hurricane force (one-minute average wind speeds of at least
74 mph) and tropical storm force (one-minute average wind speeds of
39-73 mph) winds can extend well beyond the white areas shown enclosing
the most likely track area of the center. The distribution of hurricane
and tropical storm force winds in this tropical cyclone can be seen in
the Wind History graphic linked above.
Considering the combined forecast uncertainties in track, intensity, and size, the
chances that any particular location will experience winds of 34 kt (tropical storm force),
50 kt, or 64 kt (hurricane force) from this tropical cyclone are presented in
tabular form for selected locations and forecast positions. This information is also presented in
graphical form for the 34 kt, 50 kt,
and 64 kt thresholds.
Note: A detailed definition of the NHC track forecast cone is also available.
Potential Tropical Cyclone Six Public Advisory
000
WTNT31 KNHC 110002 CCA
TCPAT1

BULLETIN
Potential Tropical Cyclone Six Intermediate Advisory Number 5A...
Corrected
NWS National Hurricane Center Miami FL       AL062021
800 PM AST Tue Aug 10 2021

Corrected direction of motion in summary section.

...DISTURBANCE LOCATED JUST SOUTH OF PUERTO RICO...
...SYSTEM LIKELY TO BECOME A TROPICAL STORM TONIGHT...


SUMMARY OF 800 PM AST...0000 UTC...INFORMATION
----------------------------------------------
LOCATION...17.6N 66.1W
ABOUT 40 MI...60 KM SE OF PONCE PUERTO RICO
ABOUT 240 MI...390 KM ESE OF SANTO DOMINGO DOMINICAN REPUBLIC
MAXIMUM SUSTAINED WINDS...40 MPH...65 KM/H
PRESENT MOVEMENT...W OR 270 DEGREES AT 17 MPH...28 KM/H
MINIMUM CENTRAL PRESSURE...1009 MB...29.80 INCHES


WATCHES AND WARNINGS
--------------------
CHANGES WITH THIS ADVISORY:

None.

SUMMARY OF WATCHES AND WARNINGS IN EFFECT:

A Tropical Storm Warning is in effect for...
* Puerto Rico, including Culebra and Vieques
* U.S. Virgin Islands
* Dominican Republic on the south coast from Punta Palenque
eastward and on the north coast from Cabo Frances Viejo eastward

A Tropical Storm Watch is in effect for...
* Dominican Republic on the north coast from Cabo Frances Viejo to
the Dominican Republic/Haiti border
* Haiti from the northern border with the Dominican Republic to
Gonaives
* Turks and Caicos Islands
* Southeastern Bahamas

A Tropical Storm Warning means that tropical storm conditions are
expected somewhere within the warning area within 36 hours.

A Tropical Storm Watch means that tropical storm conditions are
possible within the watch area.

Interests elsewhere in Haiti and the Bahamas, as well as in eastern
and central Cuba, should monitor the progress of this system.

For storm information specific to your area in the United States,
including possible inland watches and warnings, please monitor
products issued by your local National Weather Service forecast
office. For storm information specific to your area outside of the
United States, please monitor products issued by your national
meteorological service.


DISCUSSION AND OUTLOOK
----------------------
At 800 PM AST (0000 UTC), the disturbance was located by an Air
Force Reserve reconnaissance aircraft and Doppler radar data from
San Juan near latitude 17.6 North, longitude 66.1 West. The system
is moving toward the west near 17 mph (28 km/h) and this general
motion is expected to continue tonight.  A turn back toward the
west-northwest is forecast to occur early Wednesday, with a
west-northwestward motion continuing during the next few days.  On
the forecast track, the disturbance is expected to pass near the
southern coast of Puerto Rico tonight and early Wednesday, be near
or over Hispaniola on Wednesday, and be near the southeastern
Bahamas and the Turks and Caicos Islands on Thursday.

Data from the aircraft and surface observations indicate that
maximum sustained winds have increased to near 40 mph (65 km/h)
with higher gusts. Gradual strengthening is forecast during the next
day or so and the disturbance is expected to become a tropical storm
later tonight. Some weakening is likely while the system interacts
with Hispaniola on Wednesday.
* Formation chance through 48 hours...high...90 percent.
* Formation chance through 5 days...high...90 percent.

The estimated minimum central pressure based on data from the
aircraft and earlier surface observations is 1009 mb (29.80 inches).

Tropical-storm-force winds extend outward up to 40 miles (65 km),
mainly northeast of the center.  During the past few hours, a
sustained wind of 38 mph (61 km/h) and a gust to 49 mph (79 km/h)
were measured by a Weatherflow observing station at Sandy Point on
the western end of St. Croix.  A wind gust to 47 mph (76 km/h) was
reported near Yabucoa in southeastern Puerto Rico.


HAZARDS AFFECTING LAND
----------------------
Key messages for Potential Tropical Cyclone Six can be found in
the Tropical Cyclone Discussion under AWIPS header MIATCDAT1,
WMO header WTNT41 KNHC and on the web at
www.hurricanes.gov/graphics_at1.shtml?key_messages.

RAINFALL: The system is expected to produce the following rainfall
amounts:

Over the Leeward Islands, Virgin Islands, Puerto Rico, and the
Dominican Republic...2 to 4 inches, with isolated maximum totals of
6 inches. Heavy rainfall could lead to flash, urban, and small
stream flooding, along with possible rapid river rises and the
potential for mudslides across the U.S. Virgin Islands, Puerto Rico,
and the Dominican Republic.

Over Haiti, the Turks and Caicos, eastern Bahamas, and eastern
Cuba...1 to 3 inches with isolated maximum totals of 5 inches.

WIND:  Tropical storm conditions are expected in the warning areas
in the U.S. Virgin Islands and Puerto Rico during the next several
hours, and in the warning area in the Dominican Republic by early
Wednesday.  Tropical storm conditions are possible elsewhere along
the northern coasts of the Dominican Republic, northern Haiti, the
Turks and Caicos, and the southeastern Bahamas beginning late
Wednesday.

SURF:  Swells generated by the disturbance are affecting portions of
the Leeward Islands.  These swells are expected to spread across the
U.S. Virgin Islands and Puerto Rico today and reach portions of
Hispaniola on Wednesday, where they could cause life-threatening
surf and rip current conditions.  Please consult products from your
local weather office.


NEXT ADVISORY
-------------
Next complete advisory at 1100 PM AST.

$$
Forecaster Stewart
Quick Earthquake Messages M6.1 [59.6S, 26.3W] in South Sandwich Islands Region (03:22 HKT 07/08/2021)
Earthquake: 2021-08-07 03:22HKT M6.1 [59.6S, 26.3W] in South Sandwich Islands Region http://openstreetmap.org/?mlat=-59.6&mlon=-26.3.
Source link
Quick Earthquake Messages M6.3 [30.1S, 176.4W] in Kermadec Islands Region (20:52 HKT 24/07/2021)
Earthquake: 2021-07-24 20:52HKT M6.3 [30.1S, 176.4W] in Kermadec Islands Region http://openstreetmap.org/?mlat=-30.1&mlon=-176.4.
Source link