
Earthquake: 2024-11-17 20:16HKT M6.1 [28.93N, 131.33E] southeast of Ryukyu Islands http://openstreetmap.org/?mlat=28.93&mlon=131.33.
Source link
Strong Earthquake Report M6.5 [4.89S, 153.03E] in New Ireland Region, Papua New Guinea (13:38 HKT 15/11/2024)
Earthquake: 2024-11-15 13:28HKT M6.5 [4.89S, 153.03E] in New Ireland Region, Papua New Guinea http://openstreetmap.org/?mlat=-4.89&mlon=153.03.
Source link
Tropical Storm Sara Public Advisory
000
WTNT34 KNHC 142057 CCA
TCPAT4

BULLETIN
Tropical Storm Sara Advisory Number   5...Corrected
NWS National Hurricane Center Miami FL       AL192024
400 PM EST Thu Nov 14 2024

Corrected country name in the intensity forecast section

...SARA PRODUCING HEAVY RAINFALL OVER PORTIONS OF HONDURAS...
...LIFE-THREATENING AND POTENTIALLY CATASTROPHIC FLASH FLOODING AND
MUDSLIDES EXPECTED IN HONDURAS THROUGH THE WEEKEND...


SUMMARY OF 400 PM EST...2100 UTC...INFORMATION
----------------------------------------------
LOCATION...15.9N 83.5W
ABOUT 165 MI...265 KM ESE OF ISLA GUANAJA HONDURAS
ABOUT 65 MI...105 KM NNW OF CABO GRACIAS A DIOS ON NIC/HON BORDER
MAXIMUM SUSTAINED WINDS...40 MPH...65 KM/H
PRESENT MOVEMENT...W OR 270 DEGREES AT 10 MPH...17 KM/H
MINIMUM CENTRAL PRESSURE...998 MB...29.47 INCHES


WATCHES AND WARNINGS
--------------------
CHANGES WITH THIS ADVISORY:

None.

SUMMARY OF WATCHES AND WARNINGS IN EFFECT:

A Tropical Storm Warning is in effect for...
* The northern coast of Honduras form Punta Sal eastward to the
Honduras/Nicaragua Border
* The Bay Islands of Honduras

A Tropical Storm Watch is in effect for...
* The northeastern coast of Nicaragua from Puerto Cabezas northward
to the Honduras/Nicaragua Border

A Tropical Storm Warning means that tropical storm conditions are
expected somewhere within the warning area.

A Tropical Storm Watch means that tropical storm conditions are
possible within the watch area, generally within 48 hours.

Interests elsewhere in Honduras, Guatemala, Belize and the
Yucatan Peninsula should monitor the progress of this system.

For storm information specific to your area, please monitor
products issued by your national meteorological service.


DISCUSSION AND OUTLOOK
----------------------
At 400 PM EST (2100 UTC), the center of Tropical Storm Sara was
located near latitude 15.9 North, longitude 83.5 West. Sara is
moving toward the west near 10 mph (17 km/h). A westward motion at
a slower forward speed is expected during the next couple of days.
A slow west-northwestward motion is forecast by late Saturday.
On the forecast track, the center of Sara will move near the
northern coast of Honduras during the next couple of days, and
approach the coast of Belize on Sunday.

Maximum sustained winds are near 40 mph (65 km/h) with higher gusts.
Some strengthening is possible if the center of Sara remains
offshore of the northern coast of Honduras.

Tropical-storm-force winds extend outward up to 105 miles (165 km)
from the center, primarily to the north of the center.

The estimated minimum central pressure is 998 mb (29.47 inches).


HAZARDS AFFECTING LAND
----------------------
Key Messages for Tropical Storm Sara can be found in the
Tropical Cyclone Discussion under AWIPS header MIATCDAT4 and WMO
header WTNT44 KNHC and on the web at
hurricanes.gov/text/MIATCDAT4.shtml

RAINFALL: Through early next week, rainfall amounts of 10 to 20
inches with isolated storm totals around 30 inches area expected
over northern Honduras. This rainfall will lead to widespread areas
of life-threatening and potentially catastrophic flash flooding and
mudslides, especially along and near the Sierra La Esperanza.

Elsewhere across the rest of Honduras, Belize, El Salvador, eastern
Guatemala, western Nicaragua, and the Mexican State of Quintana Roo,
Sara is expected to produce 5 to 10 inches of rain with localized
totals around 15 inches through early next week. This will result in
areas of flash flooding, perhaps significant, along with the
potential of mudslides.

For a complete depiction of forecast rainfall associated with
Tropical Storm Sara, please see the National Weather
Service Storm Total Rainfall Graphic, available at
hurricanes.gov/refresh/graphics_at4+shtml/205755.shtml?
rainqpf#contents

WIND: Tropical storm conditions are expected in the warning area in
Honduras during the next couple of days.  Tropical storm conditions
are possible in the watch area in Nicaragua through tonight.

STORM SURGE: Storm surge could raise water levels by as much as 1
to 3 feet above normal tide levels along the immediate coast in
areas of onshore winds along the northern coast of Honduras. Near
the coast, the surge will be accompanied by large and destructive
waves.


NEXT ADVISORY
-------------
Next intermediate advisory at 700 PM EST.
Next complete advisory at 1000 PM EST.

$$
Forecaster Brown
Strong Earthquake Report M6.7 [19.79N, 77.01W] in Cuba Region (00:58 HKT 11/11/2024)
Earthquake: 2024-11-11 00:49HKT M6.7 [19.79N, 77.01W] in Cuba Region http://openstreetmap.org/?mlat=19.79&mlon=-77.01.
Source link
Strong Earthquake Report M6.4 [46.70S, 75.24W] in Southern Chile (19:55 HKT 08/11/2024)
Earthquake: 2024-11-08 19:38HKT M6.4 [46.70S, 75.24W] in Southern Chile http://openstreetmap.org/?mlat=-46.7&mlon=-75.24.
Source link
Preliminary Best Track Points [kmz] – Hurricane Rafael (AT3/AL182024)
KMZ last updated Fri, 08 Nov 2024 20:35:31 GMT
Source link
Strong Earthquake Report M6.1 [4.87S, 153.27E] in New Ireland Region, Papua New Guinea (22:50 HKT 06/11/2024)
Earthquake: 2024-11-06 22:36HKT M6.1 [4.87S, 153.27E] in New Ireland Region, Papua New Guinea http://openstreetmap.org/?mlat=-4.87&mlon=153.27.
Source link
TROPICAL DEPRESSION FOURTEEN-E

TROPICAL DEPRESSION FOURTEEN-E
Coastal Watches/Warnings and Forecast Cone for Storm Center

* If the storm is forecast to dissipate within 3 days, the “Full Forecast” and “3 day” graphic will be identical
Click Here for a 5-day Cone Printer Friendly Graphic
How to use the cone graphic (video):

About this product:
This graphic shows an approximate representation of coastal areas under a hurricane warning (red), hurricane watch (pink),
tropical storm warning (blue) and tropical storm watch (yellow). The orange circle indicates the current position of the
center of the tropical cyclone. The black line, when selected, and dots show the National Hurricane Center (NHC) forecast track of the center
at the times indicated. The dot indicating the forecast center location will be black if the cyclone is forecast to be
tropical and will be white with a black outline if the cyclone is forecast to be extratropical. If only an L is displayed,
then the system is forecast to be a remnant low. The letter inside the dot indicates the NHC’s forecast intensity for that time:
D: Tropical Depression – wind speed less than 39 MPH
S: Tropical Storm – wind speed between 39 MPH and 73 MPH
H: Hurricane – wind speed between 74 MPH and 110 MPH
M: Major Hurricane – wind speed greater than 110 MPH
NHC tropical cyclone forecast tracks can be in error. This forecast
uncertainty is conveyed by the track forecast “cone”, the solid white
and stippled white areas in the graphic. The solid white area depicts
the track forecast uncertainty for days 1-3 of the forecast, while the
stippled area depicts the uncertainty on days 4-5. Historical data
indicate that the entire 5-day path of the center of the tropical
cyclone will remain within the cone about 60-70% of the time. To
form the cone, a set of imaginary circles are placed along the
forecast track at the 12, 24, 36, 48, 72, 96, and 120 h positions,
where the size of each circle is set so that it encloses 67% of the
previous five years official forecast errors. The cone is then formed
by smoothly connecting the area swept out by the set of circles.
It is also important to realize that a tropical cyclone is not a point. Their
effects can span many hundreds of miles from the center. The area
experiencing hurricane force (one-minute average wind speeds of at least
74 mph) and tropical storm force (one-minute average wind speeds of
39-73 mph) winds can extend well beyond the white areas shown enclosing
the most likely track area of the center. The distribution of hurricane
and tropical storm force winds in this tropical cyclone can be seen in
the Wind History graphic linked above.
Considering the combined forecast uncertainties in track, intensity, and size, the
chances that any particular location will experience winds of 34 kt (tropical storm force),
50 kt, or 64 kt (hurricane force) from this tropical cyclone are presented in
tabular form for selected locations and forecast positions. This information is also presented in
graphical form for the 34 kt, 50 kt,
and 64 kt thresholds.
Note: A detailed definition of the NHC track forecast cone is also available.
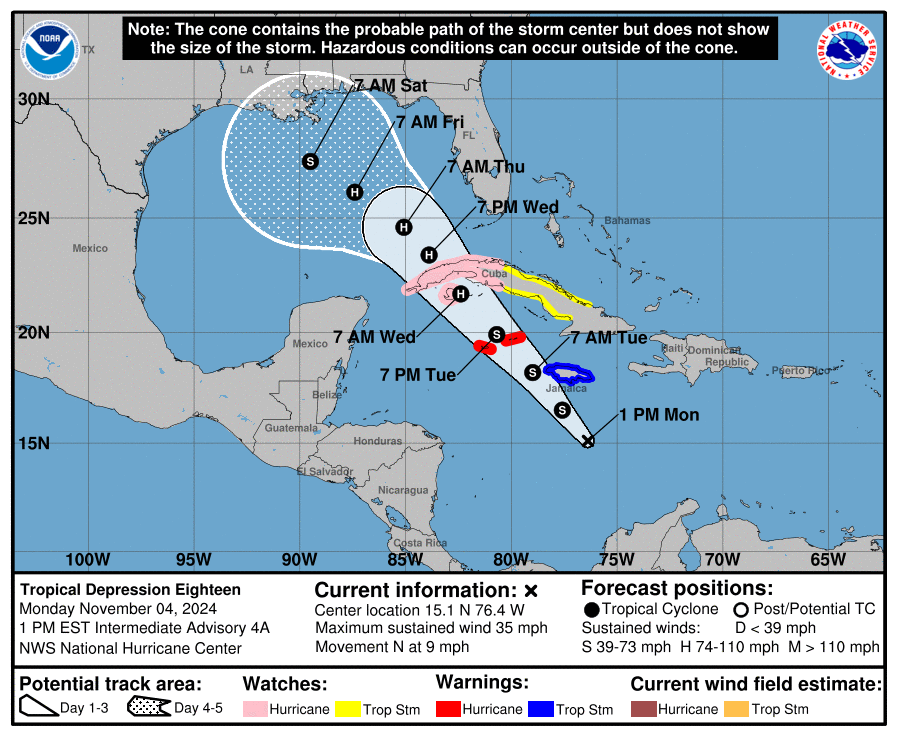
TROPICAL DEPRESSION EIGHTEEN
TROPICAL DEPRESSION EIGHTEEN
Coastal Watches/Warnings and Forecast Cone for Storm Center

* If the storm is forecast to dissipate within 3 days, the “Full Forecast” and “3 day” graphic will be identical
Click Here for a 5-day Cone Printer Friendly Graphic
How to use the cone graphic (video):
About this product:
This graphic shows an approximate representation of coastal areas under a hurricane warning (red), hurricane watch (pink),
tropical storm warning (blue) and tropical storm watch (yellow). The orange circle indicates the current position of the
center of the tropical cyclone. The black line, when selected, and dots show the National Hurricane Center (NHC) forecast track of the center
at the times indicated. The dot indicating the forecast center location will be black if the cyclone is forecast to be
tropical and will be white with a black outline if the cyclone is forecast to be extratropical. If only an L is displayed,
then the system is forecast to be a remnant low. The letter inside the dot indicates the NHC’s forecast intensity for that time:
D: Tropical Depression – wind speed less than 39 MPH
S: Tropical Storm – wind speed between 39 MPH and 73 MPH
H: Hurricane – wind speed between 74 MPH and 110 MPH
M: Major Hurricane – wind speed greater than 110 MPH
NHC tropical cyclone forecast tracks can be in error. This forecast
uncertainty is conveyed by the track forecast “cone”, the solid white
and stippled white areas in the graphic. The solid white area depicts
the track forecast uncertainty for days 1-3 of the forecast, while the
stippled area depicts the uncertainty on days 4-5. Historical data
indicate that the entire 5-day path of the center of the tropical
cyclone will remain within the cone about 60-70% of the time. To
form the cone, a set of imaginary circles are placed along the
forecast track at the 12, 24, 36, 48, 72, 96, and 120 h positions,
where the size of each circle is set so that it encloses 67% of the
previous five years official forecast errors. The cone is then formed
by smoothly connecting the area swept out by the set of circles.
It is also important to realize that a tropical cyclone is not a point. Their
effects can span many hundreds of miles from the center. The area
experiencing hurricane force (one-minute average wind speeds of at least
74 mph) and tropical storm force (one-minute average wind speeds of
39-73 mph) winds can extend well beyond the white areas shown enclosing
the most likely track area of the center. The distribution of hurricane
and tropical storm force winds in this tropical cyclone can be seen in
the Wind History graphic linked above.
Considering the combined forecast uncertainties in track, intensity, and size, the
chances that any particular location will experience winds of 34 kt (tropical storm force),
50 kt, or 64 kt (hurricane force) from this tropical cyclone are presented in
tabular form for selected locations and forecast positions. This information is also presented in
graphical form for the 34 kt, 50 kt,
and 64 kt thresholds.
Note: A detailed definition of the NHC track forecast cone is also available.
Advisory #016 Forecast Track [kmz] – Hurricane Kristy (EP2/EP122024)
KMZ last updated Fri, 25 Oct 2024 14:40:52 GMT
Source link