OpenStreetMap is a map of the world, created by people like you and free to use under an open license.
Hosting is supported by UCL, Fastly, Bytemark Hosting, and other partners.
Learn More
Start Mapping
OpenStreetMap is a map of the world, created by people like you and free to use under an open license.
Hosting is supported by UCL, Fastly, Bytemark Hosting, and other partners.
OpenStreetMap is a map of the world, created by people like you and free to use under an open license.
Hosting is supported by UCL, Fastly, Bytemark Hosting, and other partners.
OpenStreetMap is a map of the world, created by people like you and free to use under an open license.
Hosting is supported by UCL, Fastly, Bytemark Hosting, and other partners.
OpenStreetMap is a map of the world, created by people like you and free to use under an open license.
Hosting is supported by UCL, Fastly, Bytemark Hosting, and other partners.
* If the storm is forecast to dissipate within 3 days, the “Full Forecast” and “3 day” graphic will be identical
Click Here for a 5-day Cone Printer Friendly Graphic

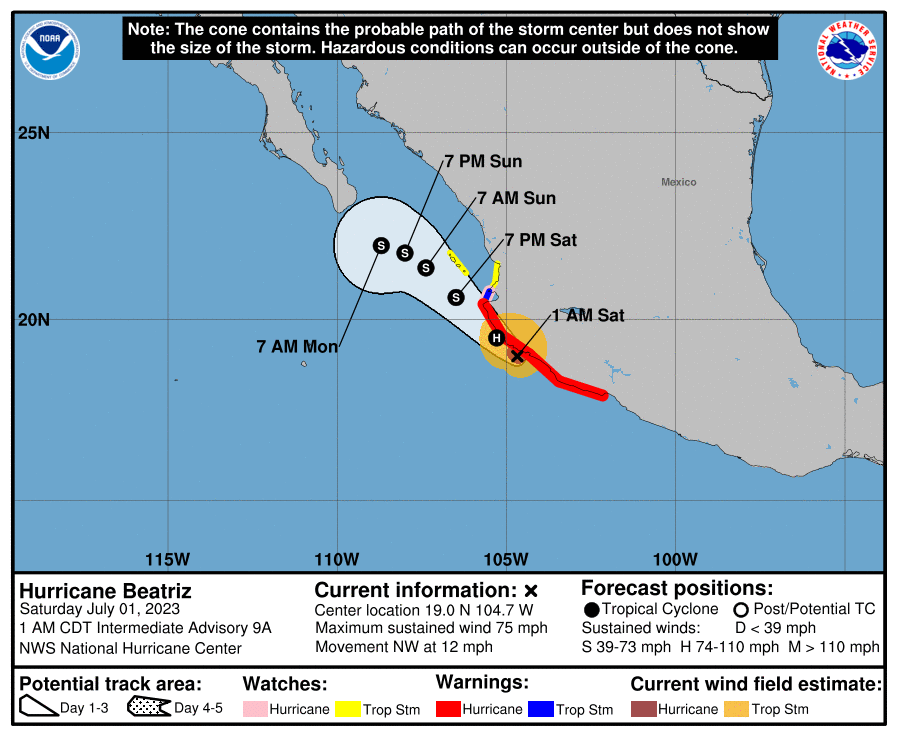
This graphic shows an approximate representation of coastal areas under a hurricane warning (red), hurricane watch (pink),
tropical storm warning (blue) and tropical storm watch (yellow). The orange circle indicates the current position of the
center of the tropical cyclone. The black line, when selected, and dots show the National Hurricane Center (NHC) forecast track of the center
at the times indicated. The dot indicating the forecast center location will be black if the cyclone is forecast to be
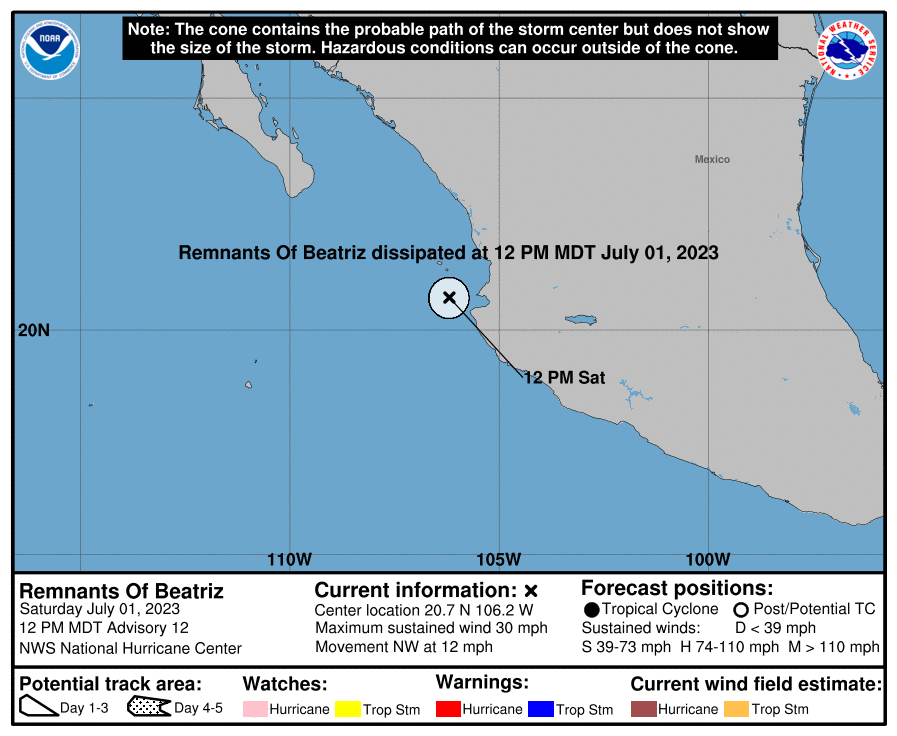
tropical and will be white with a black outline if the cyclone is forecast to be extratropical. If only an L is displayed,
then the system is forecast to be a remnant low. The letter inside the dot indicates the NHC’s forecast intensity for that time:
D: Tropical Depression – wind speed less than 39 MPH
S: Tropical Storm – wind speed between 39 MPH and 73 MPH
H: Hurricane – wind speed between 74 MPH and 110 MPH
M: Major Hurricane – wind speed greater than 110 MPH
NHC tropical cyclone forecast tracks can be in error. This forecast
uncertainty is conveyed by the track forecast “cone”, the solid white
and stippled white areas in the graphic. The solid white area depicts
the track forecast uncertainty for days 1-3 of the forecast, while the
stippled area depicts the uncertainty on days 4-5. Historical data
indicate that the entire 5-day path of the center of the tropical
cyclone will remain within the cone about 60-70% of the time. To
form the cone, a set of imaginary circles are placed along the
forecast track at the 12, 24, 36, 48, 72, 96, and 120 h positions,
where the size of each circle is set so that it encloses 67% of the
previous five years official forecast errors. The cone is then formed
by smoothly connecting the area swept out by the set of circles.
It is also important to realize that a tropical cyclone is not a point. Their
effects can span many hundreds of miles from the center. The area
experiencing hurricane force (one-minute average wind speeds of at least
74 mph) and tropical storm force (one-minute average wind speeds of
39-73 mph) winds can extend well beyond the white areas shown enclosing
the most likely track area of the center. The distribution of hurricane
and tropical storm force winds in this tropical cyclone can be seen in
the Wind History graphic linked above.
Considering the combined forecast uncertainties in track, intensity, and size, the
chances that any particular location will experience winds of 34 kt (tropical storm force),
50 kt, or 64 kt (hurricane force) from this tropical cyclone are presented in
tabular form for selected locations and forecast positions. This information is also presented in
graphical form for the 34 kt, 50 kt,
and 64 kt thresholds.
Note: A detailed definition of the NHC track forecast cone is also available.
OpenStreetMap is a map of the world, created by people like you and free to use under an open license.
Hosting is supported by UCL, Fastly, Bytemark Hosting, and other partners.
KMZ last updated Sun, 25 Jun 2023 02:35:06 GMT
Source link
000
WTNT33 KNHC 230551
TCPAT3

BULLETIN
Tropical Storm Bret Intermediate Advisory Number 15A
NWS National Hurricane Center Miami FL       AL032023
200 AM AST Fri Jun 23 2023

...CENTER OF BRET NOW OVER THE EASTERN CARIBBEAN SEA...
...HEAVY RAINS AND STRONG WINDS CONTINUE OVER PORTIONS OF THE
WINDWARD ISLANDS...


SUMMARY OF 200 AM AST...0600 UTC...INFORMATION
----------------------------------------------
LOCATION...13.4N 61.9W
ABOUT 50 MI...75 KM W OF ST. VINCENT
ABOUT 65 MI...105 KM WSW OF ST. LUCIA
MAXIMUM SUSTAINED WINDS...60 MPH...95 KM/H
PRESENT MOVEMENT...W OR 270 DEGREES AT 17 MPH...28 KM/H
MINIMUM CENTRAL PRESSURE...1001 MB...29.56 INCHES


WATCHES AND WARNINGS
--------------------
CHANGES WITH THIS ADVISORY:

None.

SUMMARY OF WATCHES AND WARNINGS IN EFFECT:

A Tropical Storm Warning in in effect for...
* Dominica
* St. Lucia
* Martinique
* Barbados
* St. Vincent and the Grenadines

A Tropical Storm Warning means that tropical storm conditions are
expected somewhere within the warning area, in this case within 24
hours.

Interests elsewhere in the Lesser Antilles and the southeastern
Caribbean Sea should monitor the progress of Bret.

For storm information specific to your area, please monitor
products issued by your national meteorological service.


DISCUSSION AND OUTLOOK
----------------------
At 200 AM AST (0600 UTC), the center of Tropical Storm Bret was
located over the eastern Caribbean Sea near latitude 13.4 North,
longitude 61.9 West.  Bret is moving toward the west near 17 mph
(28 km/h), and this general motion is expected during the next
couple of days.  On the forecast track, the center of Bret is
expected to move westward across the eastern and central Caribbean
Sea today and Saturday.

Data from an Air Force Reserve Hurricane Hunter aircraft indicate
that maximum sustained winds remain near 60 mph (95 km/h) with
higher gusts.  Gradual weakening is anticipated over the next
couple of days, and the system is likely to dissipate over the
central Caribbean Sea Saturday night or Sunday.

Tropical-storm-force winds extend outward up to 115 miles (185 km)
from the center.  Grantly Adams International Airport on Barbados
recently reported a sustained wind of 44 mph (70 km/h) and a gust
to 56 mph (91 km/h) in thunderstorm activity well to the east of
Bret's center.  Tropical storm conditions are also still being
reported on St. Lucia and Martinique.

The minimum central pressure measured from the reconnaissance
aircraft is 1001 mb (29.56 inches).


HAZARDS AFFECTING LAND
----------------------
Key messages for Bret can be found in the Tropical Cyclone
Discussion under AWIPS header MIATCDAT3, WMO header WTNT43 KNHC and
on the web at hurricanes.gov/text/MIATCDAT3.shtml

WIND:  Tropical storm conditions are expected within the tropical
storm warning areas through this morning.

RAINFALL:  Storm total rainfall amounts of 3 to 6 inches with
maximum amounts of 10 inches are possible across portions of the
Lesser Antilles from Guadeloupe south through St. Vincent and the
Grenadines, including Barbados. The heavy rainfall could lead to
flash flooding, especially across areas of higher terrain. Urban
flooding is also possible.

SURF:  Swells generated by Bret are expected to affect portions of
the Lesser Antilles through today.  These swells are likely to
cause life-threatening surf and rip current conditions.  Please
consult products from your local weather office.


NEXT ADVISORY
-------------
Next complete advisory at 500 AM AST.

$$
Forecaster Berg
OpenStreetMap is a map of the world, created by people like you and free to use under an open license.
Hosting is supported by UCL, Fastly, Bytemark Hosting, and other partners.
OpenStreetMap is a map of the world, created by people like you and free to use under an open license.
Hosting is supported by UCL, Fastly, Bytemark Hosting, and other partners.